Industrial Properties
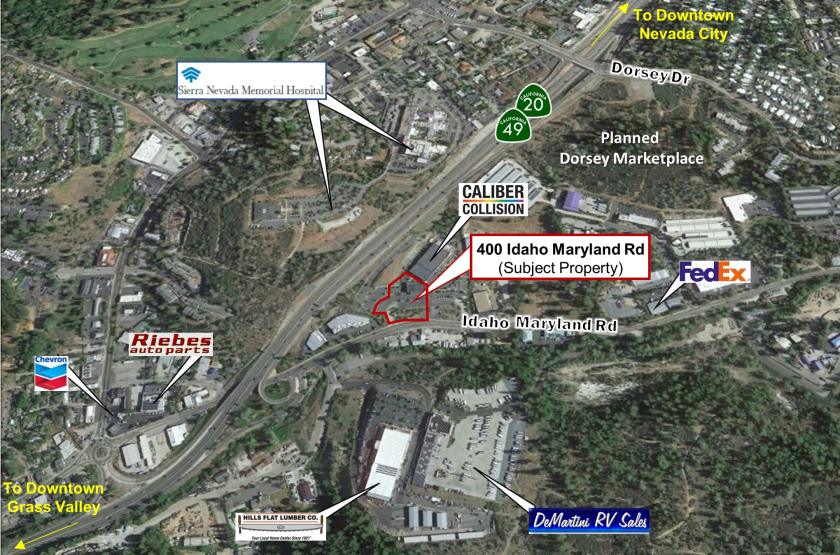
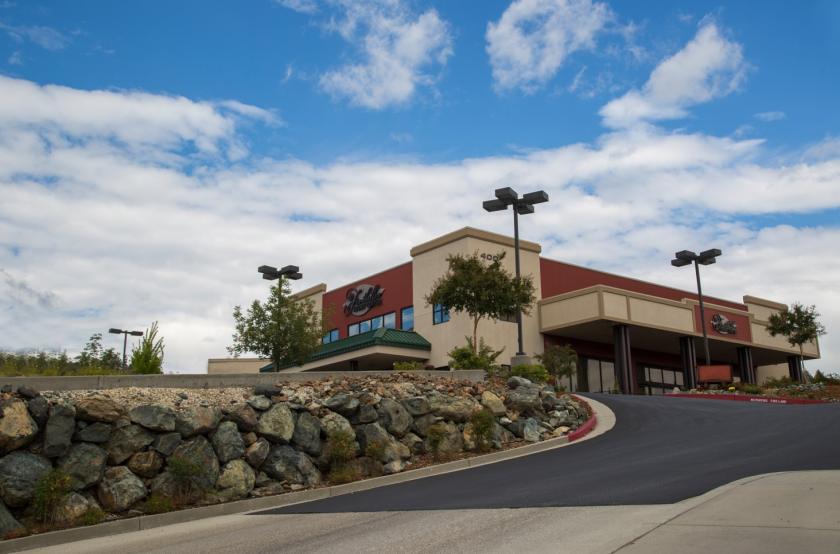
400 Idaho Maryland Road Grass Valley, CA 95945
400 Idaho Maryland Road Grass Valley, CA 95945

Details & Description
Property Highlights
• M1 zoning allows industrial, retail, storage, cannabis and most other in-demand uses.
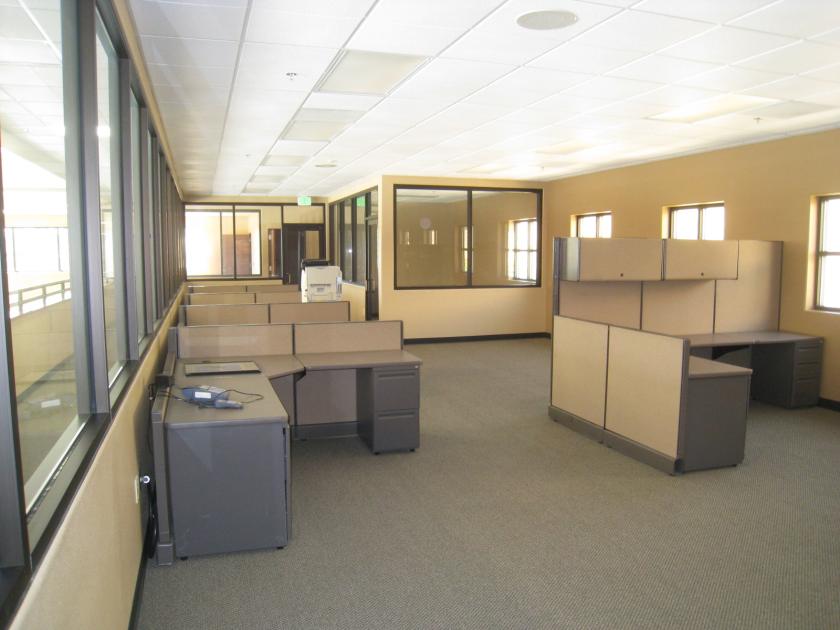
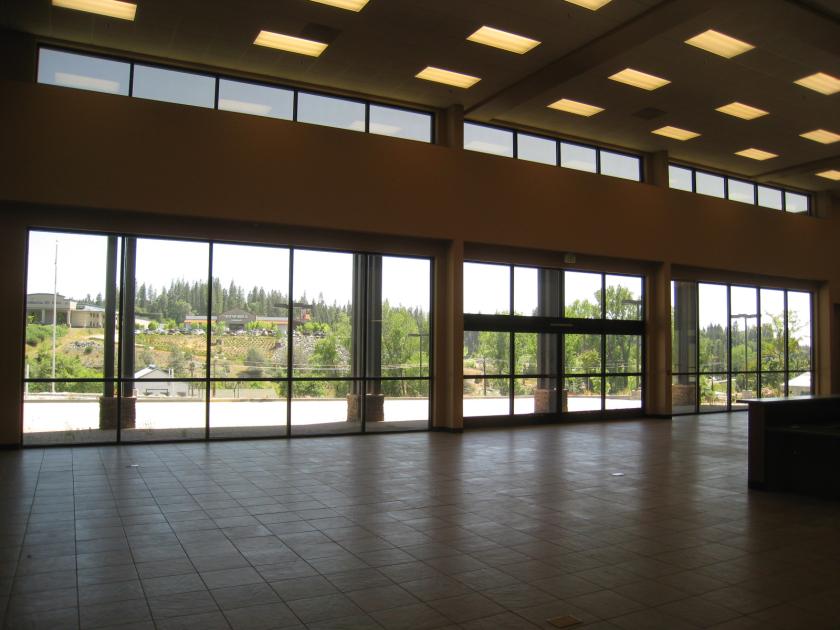
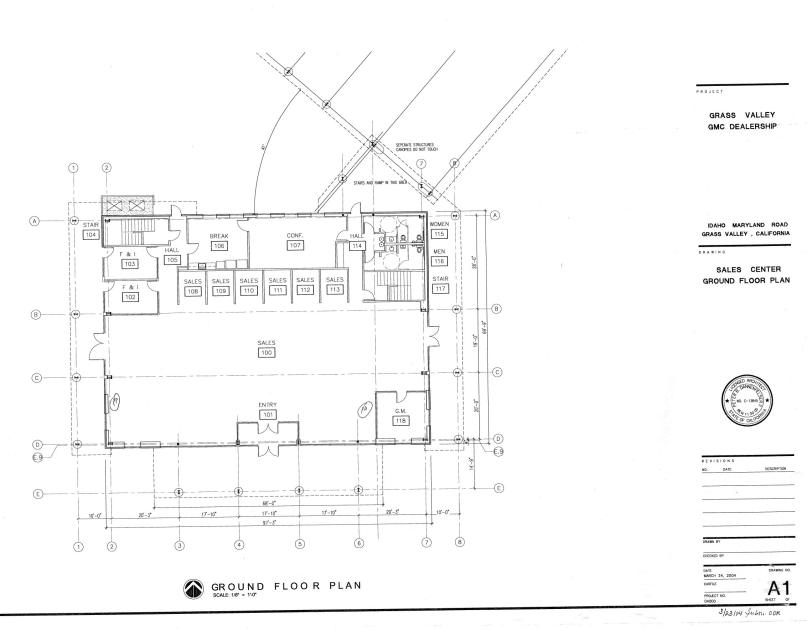
• 10,599 SF flexible-use building with outstanding highway visibility and access.
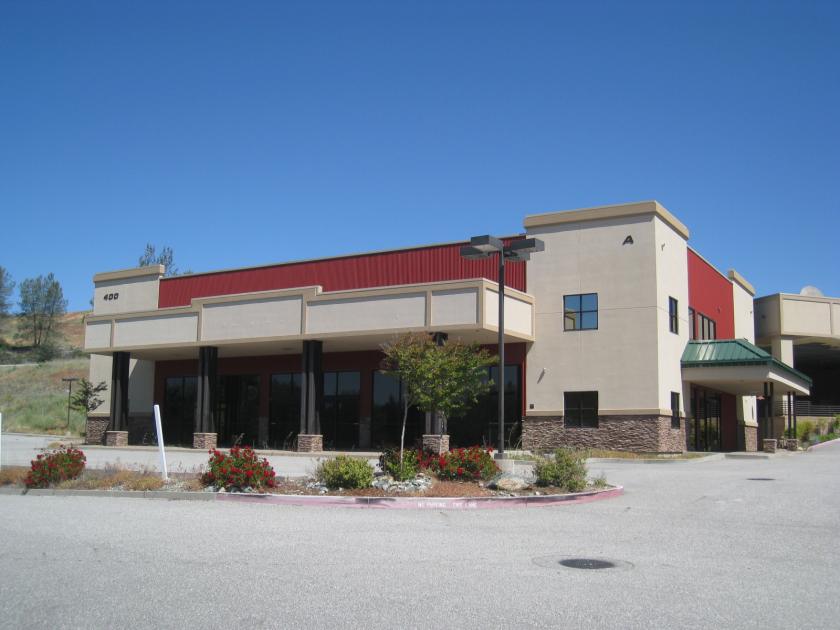
Additional Photos

Listing Agents

Lock Richards
O: 530-470-1740
lock@highlandcre.com
O: 530-470-1740
lock@highlandcre.com
While we strive to provide the most accurate information, all listing information, and demographic data, is provided by third-parties. As such, MyEListing will not be responsible for the accuracy of the information. It is strongly recommended that you verify all information with the listing agent, and any relevant agencies, prior to making any decisions.