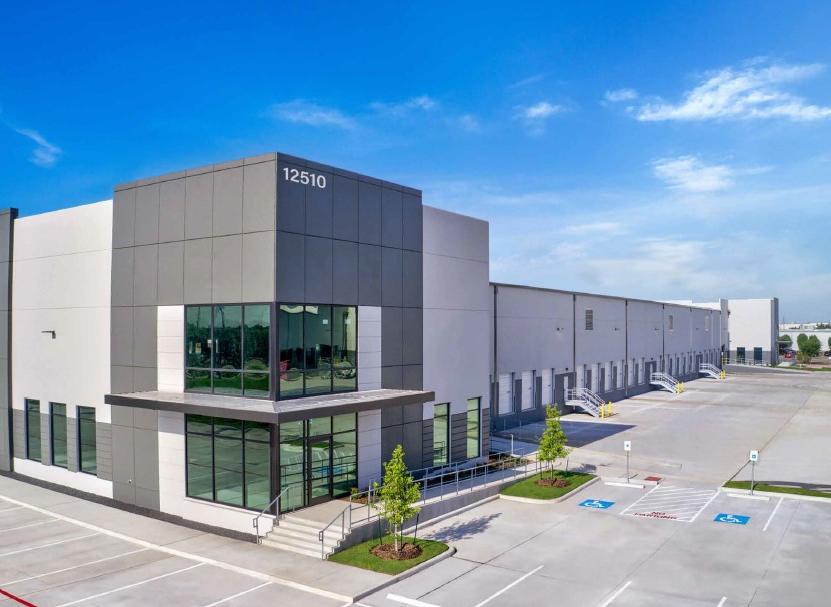
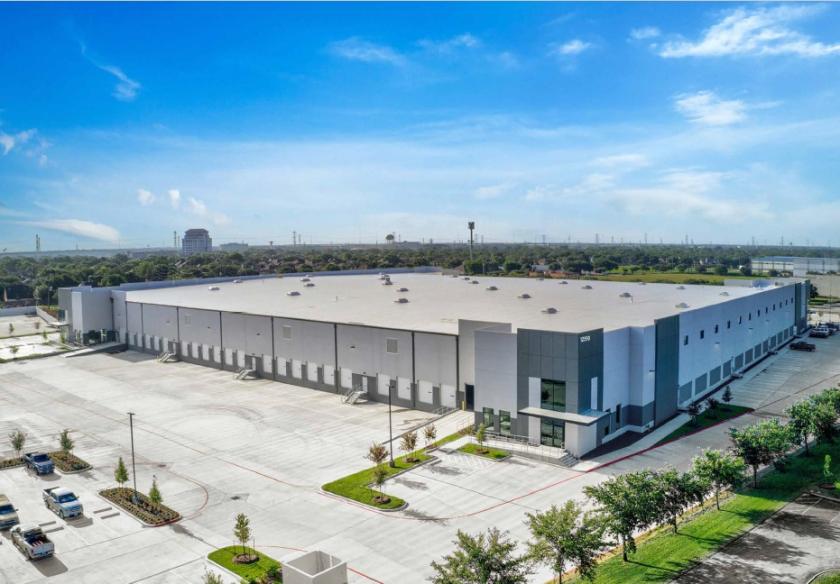
Cubework Sugar Land presents the opportunity to escalate business operations with its unbeatable logistical capabilities and state-of-the-art technology in the commanding Houston market. 12510 W Airport Boulevard offers up to 20,000 SF of highly flexible warehouse distribution space with access to Cubework’s industry-leading amenities and services. The sublease includes 24/7 building access, high-speed WiFi, conference/event rooms, and night security guards so tenants can enjoy peace of mind. 12510 W Airport Boulevard features an efficient layout with 42 dock high doors, 13 trailer parking spaces, 32-foot warehouse ceiling height, a security gate, 193 car parks, and a 3,030 SF office. Signing with Cubework provides an all-inclusive experience with no common area maintenance or operating expenses, most utilities covered, CCTV security cameras, basic trash service, and access to forklift rentals. Cubework is the fastest-growing industrial workspace company in the United States, with a growing portfolio of more than 50 locations. Tenants of Cubework can expect modern and refreshing private offices, on-demand warehouse units, and co-working spaces complete with on-site staff to assist with front desk service, IT support, business support, and cleaning crews. Additionally, businesses enjoy complimentary office supplies, printers, copiers, fax machines, furnished workspaces, mail and packaging handling, kitchen amenities, fresh coffee, tea, and much more. Strategically positioned approximately two miles from Interstate 69, Cubework Sugar Land places tenants in the middle of it all. Via this unmatched connection, distributors can reach their destinations by any means of transport. Downtown Houston is 30 minutes away. William P. Hobby Airport is 24.6 miles away, and the Port of Houston 50 is miles away. This connection has brought a throng of major tenants to Sugar Land, Texas which is currently undergoing a period of unprecedented growth as companies including Amazon, Rooms to Go, and Soft-Tex signed more than four million SF in the submarket last year. Cubework Sugar Land is also connected to many workforce amenities with Fountains on the Lake shopping center featuring Main Event Stafford, Old Navy, GNC, Hobby Lobby, and dozens of trendy restaurants seven minutes away. 51,738 of 160,497 employees in a 5-mile radius work in trade transportation, utilities, and goods-producing industries with a median household income of $55,536, to provide an affordable labor pool. 12510 W Airport Boulevard’s idyllic location combined with Cubework’s superior technologies and services creates the perfect launching point for businesses to grow and thrive in the bustling Houston industrial market. Enquire now.