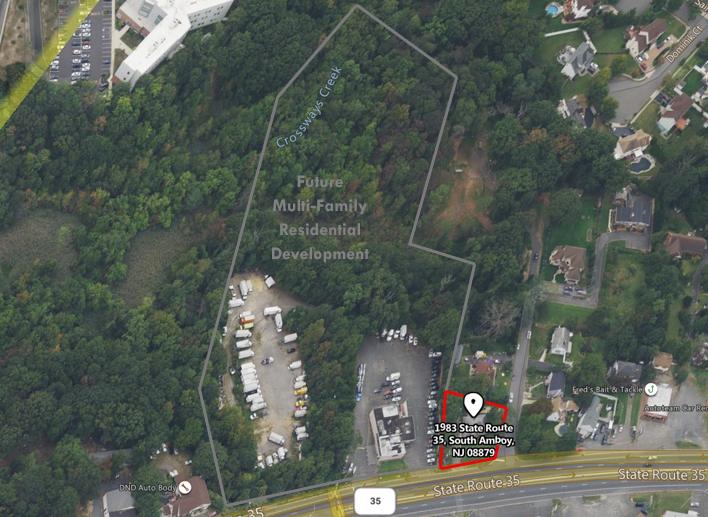
1-Mile | 3-Miles | 5-Miles | ||
---|---|---|---|---|
Total Population | 12,067 | 65,862 | 191,925 | |
Population Median Age | 39 | 40 | 39 | |
Population by Age | 0-9 Yrs | 1509 (12%) | 7925 (12%) | 22784 (11%) |
10-19 Yrs | 1066 (8%) | 6921 (10%) | 22484 (11%) | |
20-29 Yrs | 1715 (14%) | 8171 (12%) | 25588 (13%) | |
30-39 Yrs | 2147 (17%) | 9618 (14%) | 27464 (14%) | |
40-49 Yrs | 1409 (11%) | 8237 (12%) | 25872 (13%) | |
50-59 Yrs | 1830 (15%) | 10614 (16%) | 28010 (14%) | |
60-69 Yrs | 1462 (12%) | 8631 (13%) | 22277 (11%) | |
70+ Yrs | 929 (7%) | 5744 (8%) | 17447 (9%) | |
Median HH Income | $83,530 | $78,348 | $76,433 | |
Total Household Income | < 24K | 501 (10%) | 3177 (12%) | 10646 (15%) |
25-49K | 1055 (21%) | 4407 (17%) | 12392 (17%) | |
50-74K | 744 (14%) | 4432 (17%) | 11880 (16%) | |
75-99K | 560 (11%) | 3176 (12%) | 9230 (13%) | |
100-199K | 1546 (31%) | 7255 (29%) | 19998 (28%) | |
200K+ | 575 (11%) | 2435 (9%) | 6749 (9%) | |
Highest Education Level | No Diploma | 688 | 5741 | 18070 |
Diploma or GED | 2022 | 13803 | 41470 | |
Some College | 2088 | 8630 | 23990 | |
Assoc. Degree | 604 | 3279 | 10063 | |
Bachelors Degree | 2459 | 10844 | 28216 | |
Higher Degree | 1008 | 5109 | 13458 | |
Total Housing Units | 5,158 | 25,925 | 74,100 | |
--Owner-Occupied | 2,878 | 14,449 | 39,044 | |
--Renter-Occupied | 2,103 | 10,434 | 31,851 | |
Owner-Occupied Values | < 100K | 22 | 494 | 1049 |
100-199K | 276 | 1793 | 3484 | |
200-299K | 952 | 4924 | 12444 | |
300-399K | 958 | 4461 | 10355 | |
400-499K | 387 | 1379 | 4573 | |
500K+ | 282 | 1397 | 7139 | |
Total Working Age Population | 9,820 | 53,653 | 155,278 | |
In Work Force | 7,108 | 36,868 | 104,367 | |
Not In Work Force | 2,712 | 16,785 | 50,911 | |
Workforce Employed | 6,878 | 35,099 | 98,859 | |
Workforce Unemployed | 230 | 1,769 | 5,476 | |
Civlian Workforce | 7,108 | 36,868 | 104,335 | |
Military Workforce | 0 | 0 | 32 | |
Total Households | 4,980 | 24,883 | 70,895 | |
Family Households | 3,054 | 17,002 | 49,323 | |
Non-Family Households | 1,926 | 7,881 | 21,572 | |
Married Couple | 2,204 | 11,978 | 34,644 | |
Other Family | 850 | 5,024 | 14,679 | |
Married w/Child | 1,030 | 4,951 | 14,183 | |
Single Male w/Child | 106 | 635 | 1,778 | |
Single Female w/Child | 148 | 1,196 | 4,731 |
Population Change Last Two Decades - Plus Projection
2000 | % | 2010 | % | 2020 | % | 2030 | |
---|---|---|---|---|---|---|---|
New Jersey | 8,414,350 | +4 | 8,791,894 | +4 | 9,132,700 | +4 | 9,530,900 |
Middlesex County | 750,162 | +8 | 809,858 | +8 | 873,400 | +7 | 932,200 |
Monmouth County | 615,301 | +2 | 630,380 | 0 | 633,400 | +3 | 655,300 |
New York | 18,976,457 | +2 | 19,378,102 | +4 | 20,146,131 | +2 | 20,604,030 |
Richmond County | 443,728 | +6 | 468,730 | +3 | 481,351 | +1 | 488,119 |
Total Working Age Population:
Total Households:
Total Working Age Population:
Total Households:
Total Working Age Population:
Total Households: