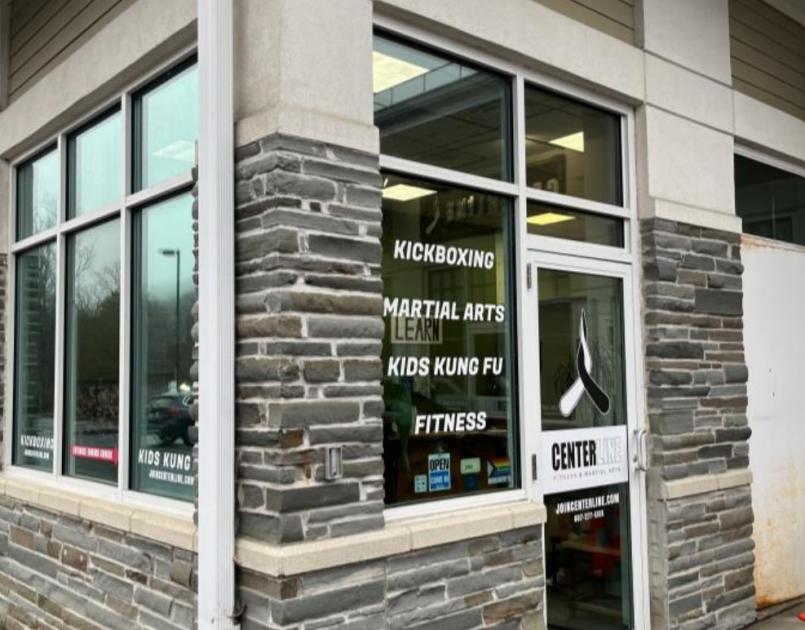
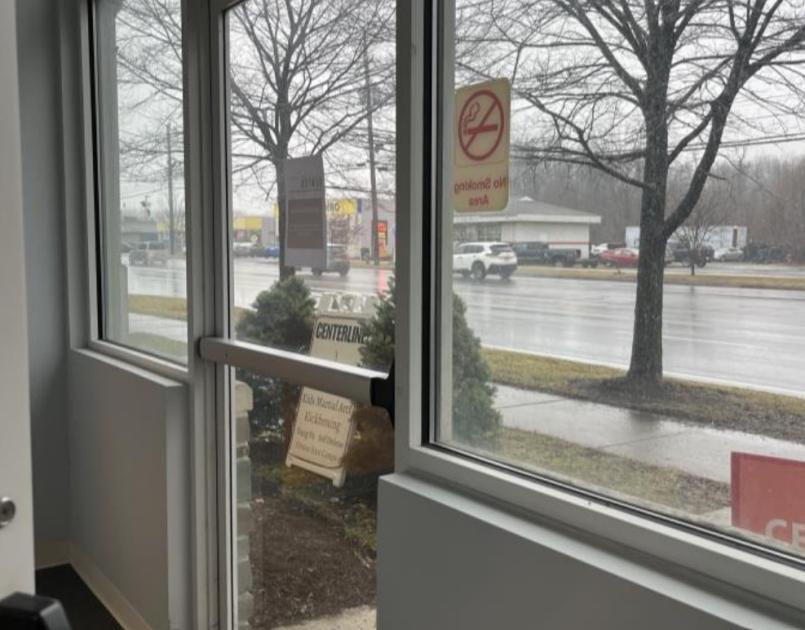
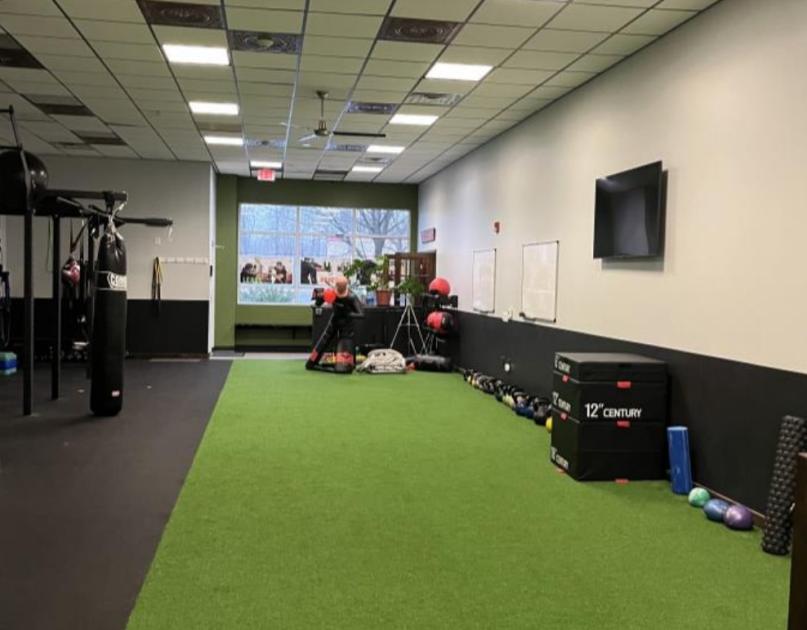
Retail Space
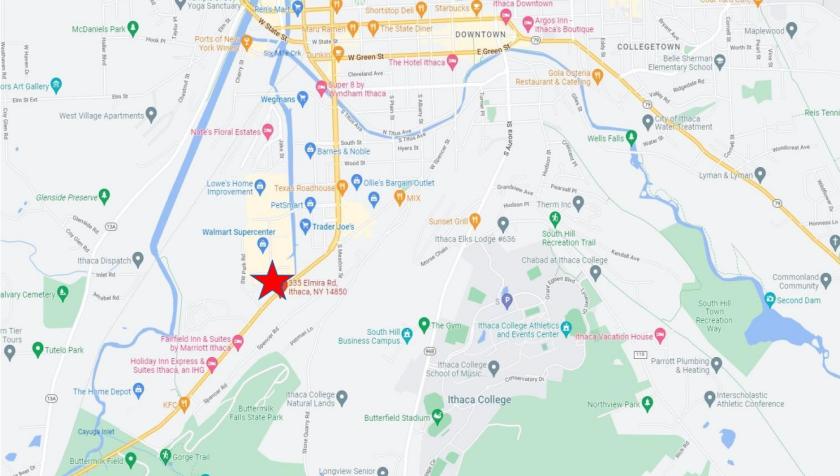
335 Elmira Road Ithaca, NY 14850
335 Elmira Road Ithaca, NY 14850
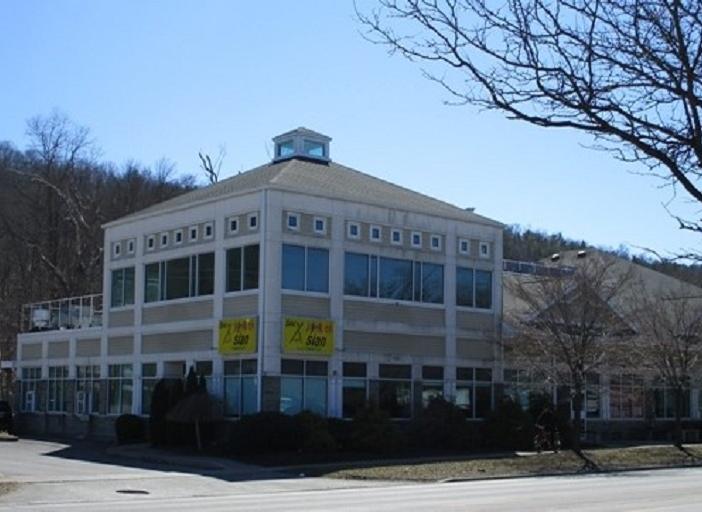
Details & Description
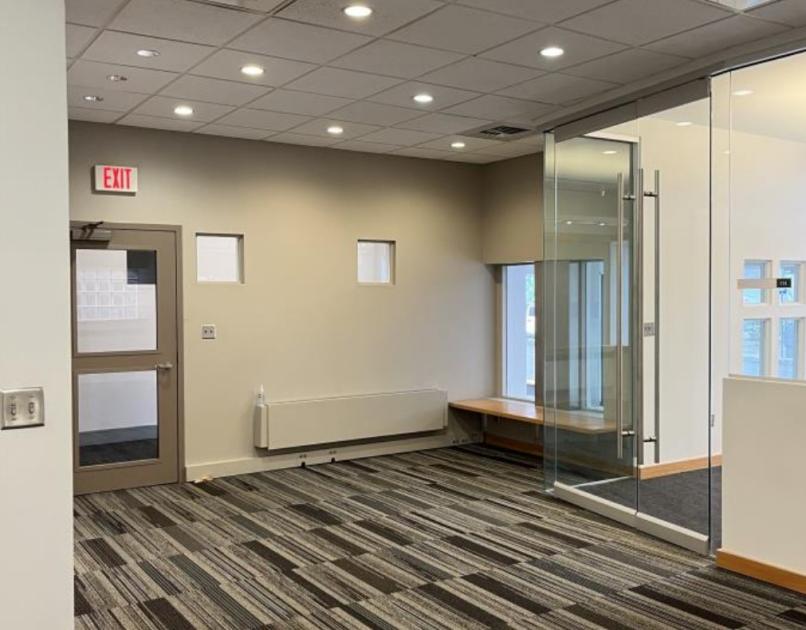
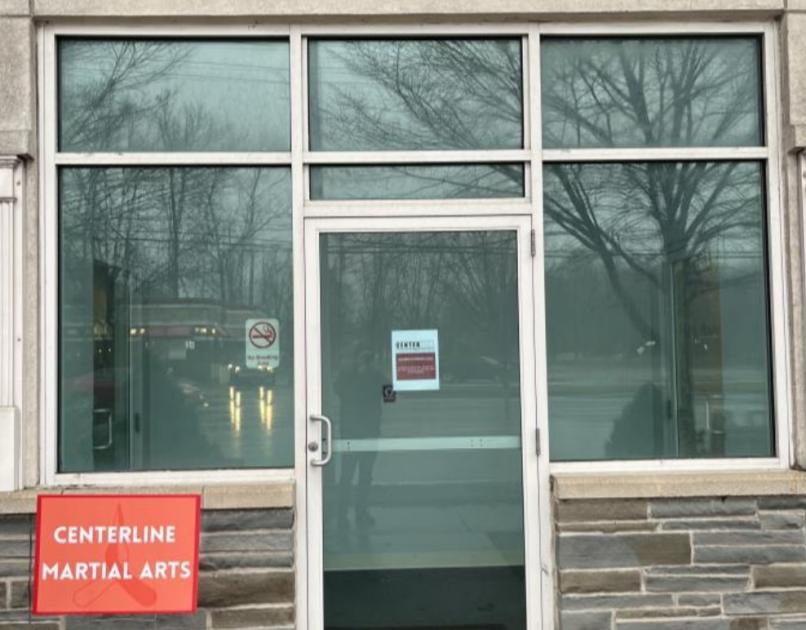
Additional Photos
Listing Agents

David Huckle
O: 607-277-2327
M: 607-227-7558
dhuckle@pyramidbrokerage.com
O: 607-277-2327
M: 607-227-7558
dhuckle@pyramidbrokerage.com
While we strive to provide the most accurate information, all listing information, and demographic data, is provided by third-parties. As such, MyEListing will not be responsible for the accuracy of the information. It is strongly recommended that you verify all information with the listing agent, and any relevant agencies, prior to making any decisions.