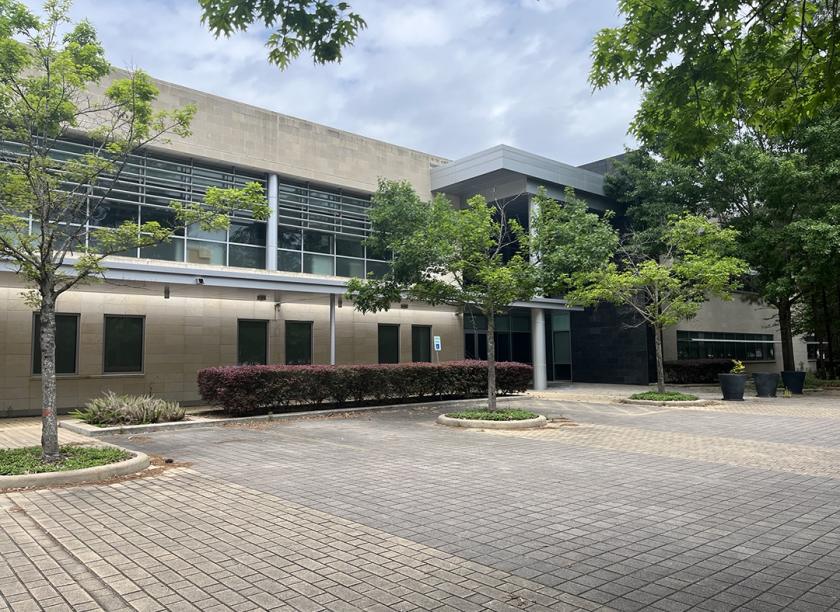
Office Space
4601 Westway Park Boulevard Houston, TX 77041
4601 Westway Park Boulevard Houston, TX 77041
Details & Description
Property Highlights
- • 2 story open lobby with plenty of windows
- • Easy access to Beltway / Toll Road
- • Interior includes polished wood and tile finishes
- • Floor plates are perfect for single-floor tenants
- • Conference/Training room available open to lobby
- • Owner-occupied property
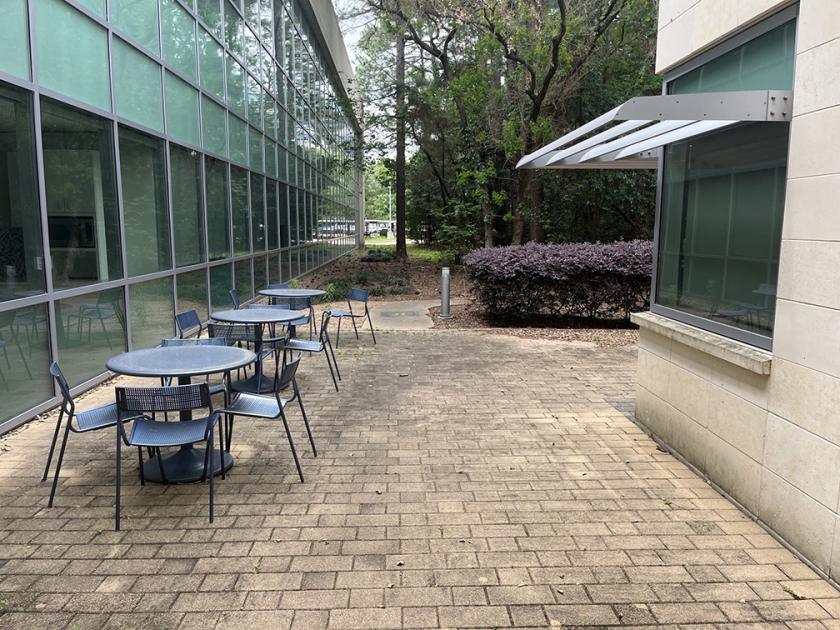
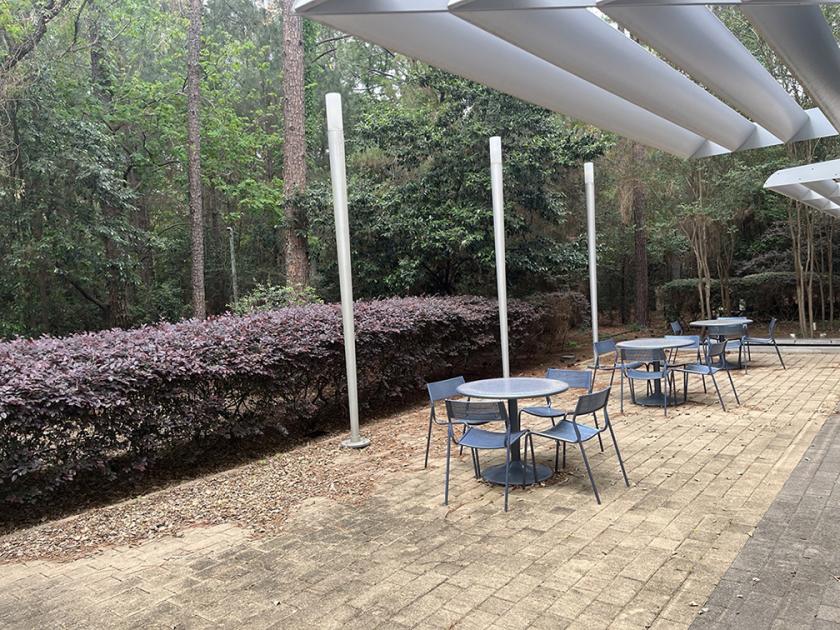
Additional Photos


Listing Agents

Douglas Pack
O: 713-835-0041
M: 713-818-5782
doug.pack@colliers.com
O: 713-835-0041
M: 713-818-5782
doug.pack@colliers.com

Sam Hansen
O: 713-835-0040
M: 281-684-1766
sam.hansen@colliers.com
O: 713-835-0040
M: 281-684-1766
sam.hansen@colliers.com
While we strive to provide the most accurate information, all listing information, and demographic data, is provided by third-parties. As such, MyEListing will not be responsible for the accuracy of the information. It is strongly recommended that you verify all information with the listing agent, and any relevant agencies, prior to making any decisions.


