Commercial Land
3400 Mission Road San Antonio, TX 78214
3400 Mission Road San Antonio, TX 78214

Details & Description
Property Highlights
- • Platted lot (Partially) 4.718 AC
- • Located near San Antonio Missions
- • Surrounded by SE Military retail
- • Close proximity to Brooks
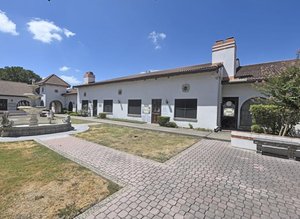
Additional Photos


Listing Agents

Gilles Ghez
O: 210-222-2424
M: 210-872-4382
gghez@dhrp.us
O: 210-222-2424
M: 210-872-4382
gghez@dhrp.us

Kim Ghez
O: 210-222-2424
M: 210-867-0004
kghez@dhrp.us
O: 210-222-2424
M: 210-867-0004
kghez@dhrp.us
While we strive to provide the most accurate information, all listing information, and demographic data, is provided by third-parties. As such, MyEListing will not be responsible for the accuracy of the information. It is strongly recommended that you verify all information with the listing agent, and any relevant agencies, prior to making any decisions.