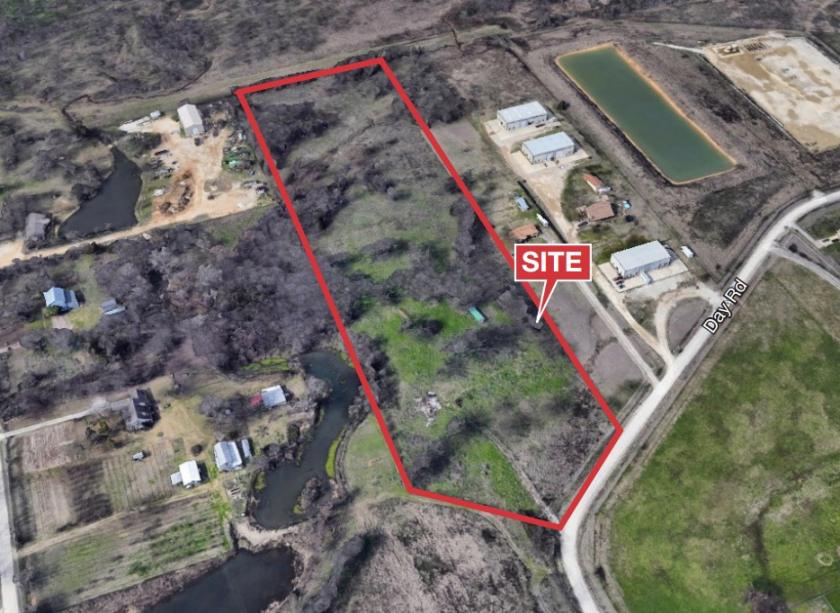
Commercial Land
14315 Day Road Roanoke, TX 76262
14315 Day Road Roanoke, TX 76262
Details & Description
Property Highlights
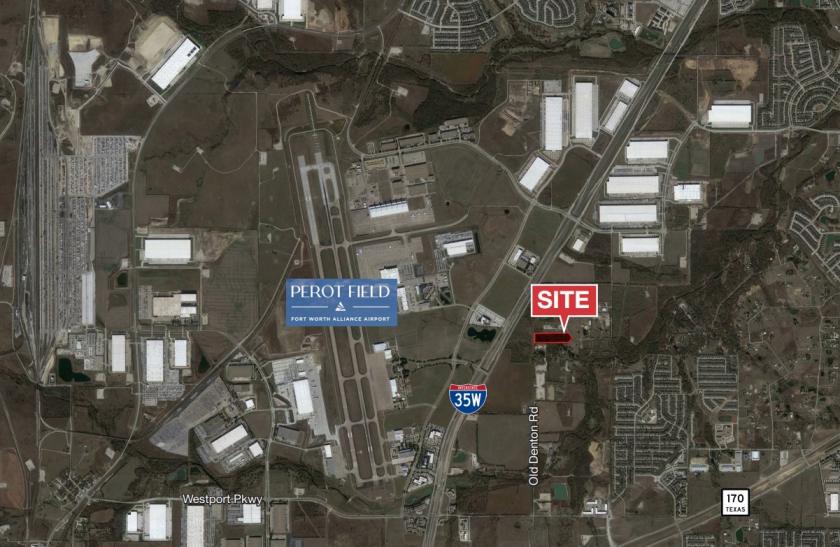
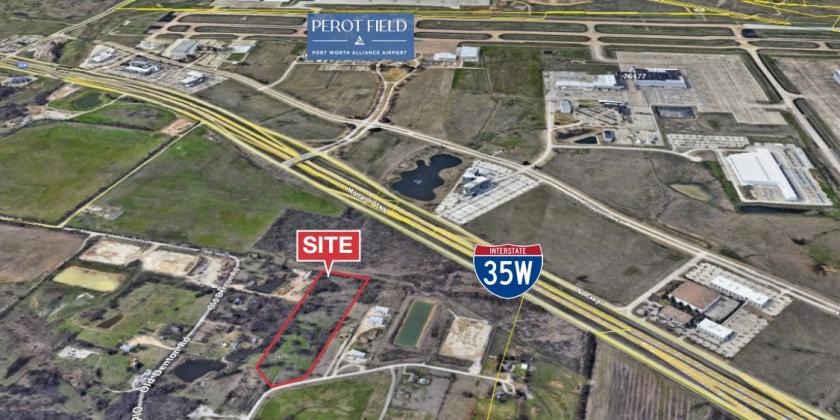
- • Close Proximity to I-35W
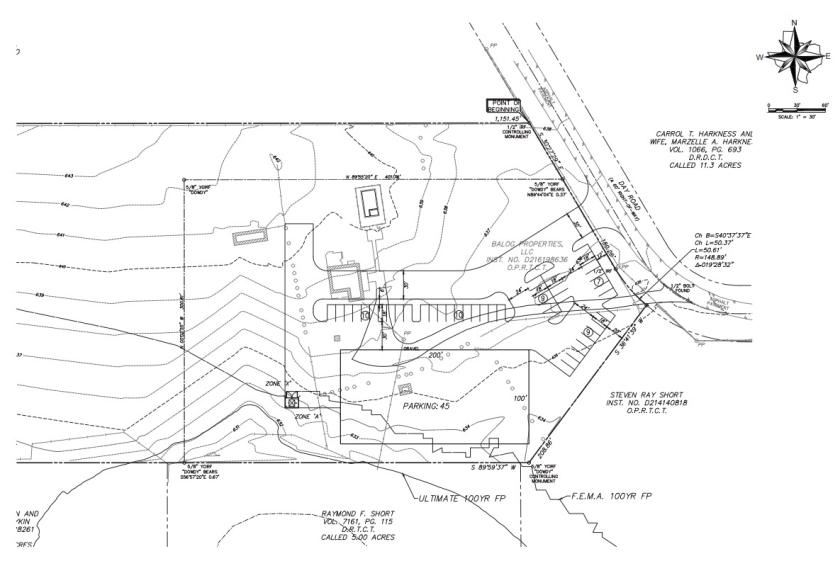
- • Full Tree Survey Conducted
- • Various Engineering Studies Available
- • Zoning: I - Light Industrial
Additional Photos
Listing Agents

Jeffry Jackson
O: 817-872-3910
M: 817-559-1991
jjackson@nairl.com
O: 817-872-3910
M: 817-559-1991
jjackson@nairl.com

Todd Hubbard
NAI Robert Lynn
O: 817-872-3901
M: 817-501-2012
thubbard@nairl.com
NAI Robert Lynn
O: 817-872-3901
M: 817-501-2012
thubbard@nairl.com

Jordan Johnson
O: 817-872-3912
M: 817-437-2761
jjohnson@nairl.com
O: 817-872-3912
M: 817-437-2761
jjohnson@nairl.com
While we strive to provide the most accurate information, all listing information, and demographic data, is provided by third-parties. As such, MyEListing will not be responsible for the accuracy of the information. It is strongly recommended that you verify all information with the listing agent, and any relevant agencies, prior to making any decisions.


