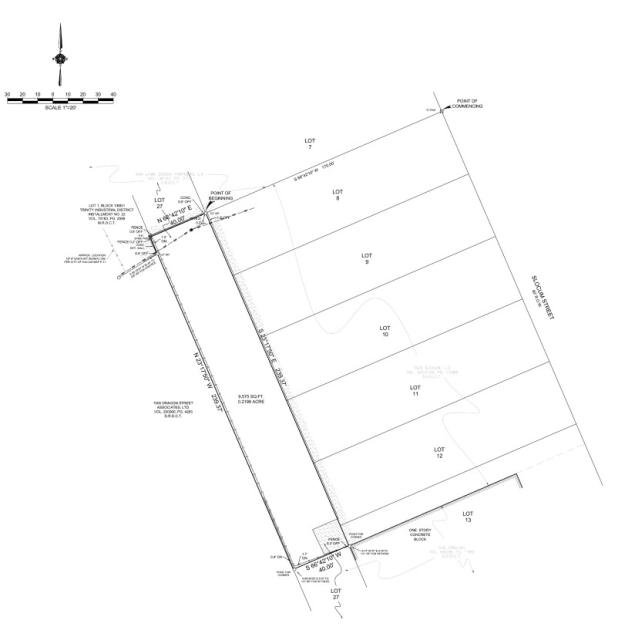
1-Mile | 3-Miles | 5-Miles | ||
---|---|---|---|---|
Total Population | 15,787 | 153,907 | 352,831 | |
Population Median Age | 36 | 36 | 36 | |
Population by Age | 0-9 Yrs | 592 (3%) | 10276 (6%) | 38105 (10%) |
10-19 Yrs | 453 (2%) | 10240 (6%) | 37571 (10%) | |
20-29 Yrs | 5982 (37%) | 44144 (28%) | 75443 (21%) | |
30-39 Yrs | 3875 (24%) | 33949 (22%) | 63777 (18%) | |
40-49 Yrs | 1674 (10%) | 19386 (12%) | 45503 (12%) | |
50-59 Yrs | 1541 (9%) | 17174 (11%) | 40648 (11%) | |
60-69 Yrs | 1027 (6%) | 11128 (7%) | 31464 (8%) | |
70+ Yrs | 642 (4%) | 7610 (4%) | 20320 (5%) | |
Median HH Income | $93,689 | $74,474 | $69,573 | |
Total Household Income | < 24K | 1121 (11%) | 12357 (15%) | 27780 (18%) |
25-49K | 910 (9%) | 12909 (16%) | 27425 (17%) | |
50-74K | 1876 (19%) | 14875 (18%) | 26567 (17%) | |
75-99K | 1120 (11%) | 10493 (13%) | 18111 (11%) | |
100-199K | 2952 (31%) | 19288 (24%) | 31820 (20%) | |
200K+ | 1509 (15%) | 9799 (12%) | 21491 (14%) | |
Highest Education Level | No Diploma | 971 | 14527 | 43391 |
Diploma or GED | 1041 | 14535 | 39597 | |
Some College | 1449 | 17377 | 35401 | |
Assoc. Degree | 397 | 5198 | 10162 | |
Bachelors Degree | 5456 | 40450 | 72380 | |
Higher Degree | 3229 | 26204 | 46830 | |
Total Housing Units | 10,759 | 90,932 | 172,747 | |
--Owner-Occupied | 1,270 | 20,599 | 59,495 | |
--Renter-Occupied | 8,219 | 59,121 | 93,698 | |
Owner-Occupied Values | < 100K | 108 | 1464 | 9240 |
100-199K | 180 | 3759 | 11350 | |
200-299K | 210 | 2990 | 7351 | |
300-399K | 71 | 3086 | 6363 | |
400-499K | 114 | 2492 | 5490 | |
500K+ | 586 | 6809 | 19700 | |
Total Working Age Population | 14,898 | 137,215 | 292,017 | |
In Work Force | 12,355 | 103,786 | 207,478 | |
Not In Work Force | 2,543 | 33,428 | 84,539 | |
Workforce Employed | 12,117 | 99,519 | 197,270 | |
Workforce Unemployed | 238 | 4,239 | 10,074 | |
Civlian Workforce | 12,355 | 103,758 | 207,344 | |
Military Workforce | 0 | 28 | 134 | |
Total Households | 9,488 | 79,721 | 153,193 | |
Family Households | 2,193 | 26,046 | 69,848 | |
Non-Family Households | 7,296 | 53,675 | 83,346 | |
Married Couple | 1,558 | 18,530 | 48,448 | |
Other Family | 634 | 7,516 | 21,400 | |
Married w/Child | 194 | 4,827 | 18,506 | |
Single Male w/Child | 47 | 654 | 1,998 | |
Single Female w/Child | 245 | 2,986 | 8,183 |
Population Change Last Two Decades - Plus Projection
2000 | % | 2010 | % | 2020 | % | 2030 | |
---|---|---|---|---|---|---|---|
Texas | 20,851,820 | +21 | 25,145,561 | +18 | 29,677,668 | +18 | 34,894,452 |
Dallas County | 2,218,899 | +7 | 2,368,139 | +15 | 2,734,111 | +14 | 3,106,298 |
Total Working Age Population:
Total Households:
Total Working Age Population:
Total Households:
Total Working Age Population:
Total Households: