Commercial Land
SWC Rochelle Rd and Hwy 161 Irving, TX 75062
SWC Rochelle Rd and Hwy 161 Irving, TX 75062
Details & Description
Property Highlights
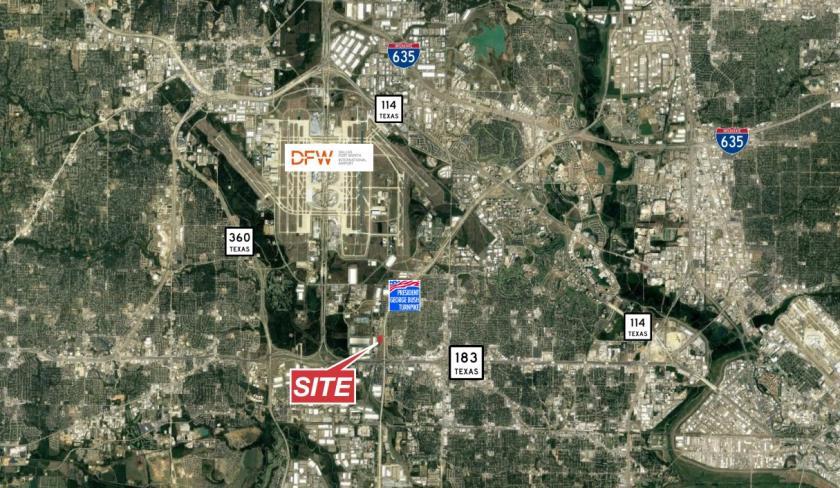
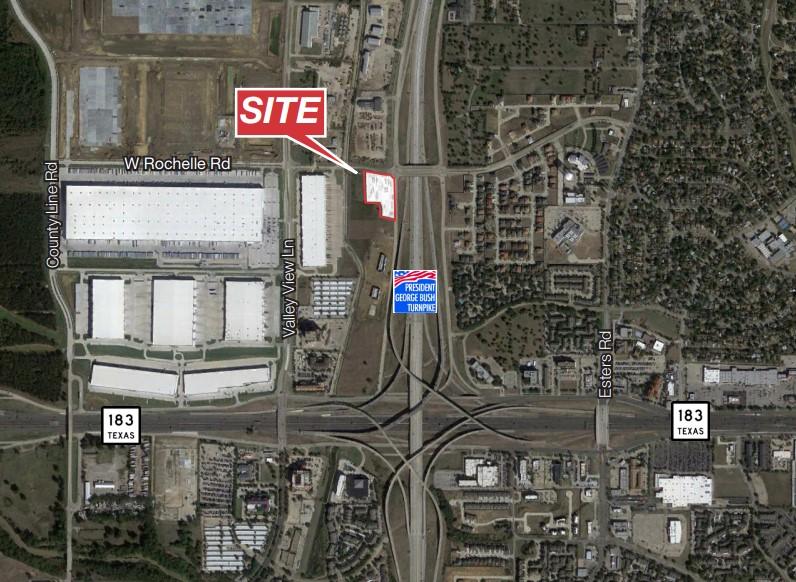
• Close Proximity to DFW International Airport
• Great Access to George Bush Turnpike
Listing Agents

Tyler Tillery
O: 214-256-7140
M: 940-389-6884
ttillery@robertlynn.com
O: 214-256-7140
M: 940-389-6884
ttillery@robertlynn.com
While we strive to provide the most accurate information, all listing information, and demographic data, is provided by third-parties. As such, MyEListing will not be responsible for the accuracy of the information. It is strongly recommended that you verify all information with the listing agent, and any relevant agencies, prior to making any decisions.