Commercial Land
2126 Rufe Snow Drive Keller, TX 76248
2126 Rufe Snow Drive Keller, TX 76248
Details & Description
Property Highlights
• Zoning: R (Retail)
• Utilities to Site
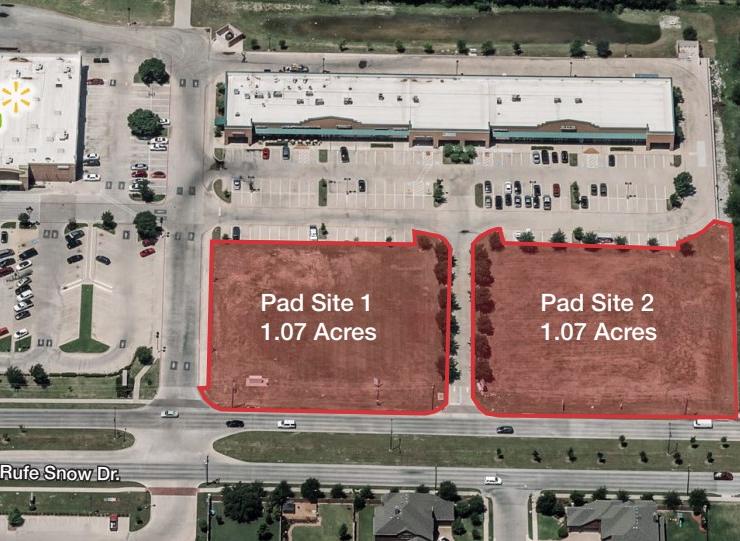
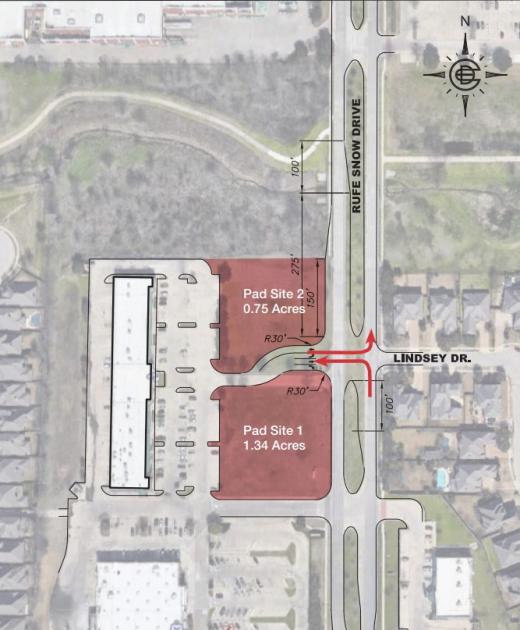
Additional Photos
Listing Agents

Hunter Hayes
O: 817-872-3911
M: 817-487-7200
hhayes@nairl.com
O: 817-872-3911
M: 817-487-7200
hhayes@nairl.com

Dan Avnery
M: 469-231-7171
davnery@nairl.com
M: 469-231-7171
davnery@nairl.com

Stewart Korte
O: 214-256-7152
M: 210-827-2827
skorte@nairl.com
O: 214-256-7152
M: 210-827-2827
skorte@nairl.com
While we strive to provide the most accurate information, all listing information, and demographic data, is provided by third-parties. As such, MyEListing will not be responsible for the accuracy of the information. It is strongly recommended that you verify all information with the listing agent, and any relevant agencies, prior to making any decisions.


