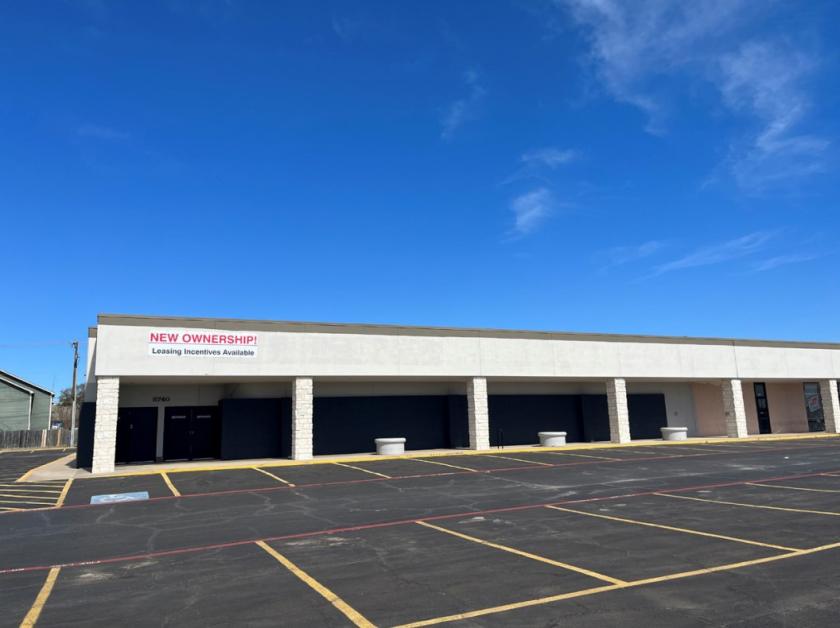
Retail Space
8744 Camp Bowie West Boulevard Fort Worth, TX 76116
8744 Camp Bowie West Boulevard Fort Worth, TX 76116

Details & Description
Property Highlights
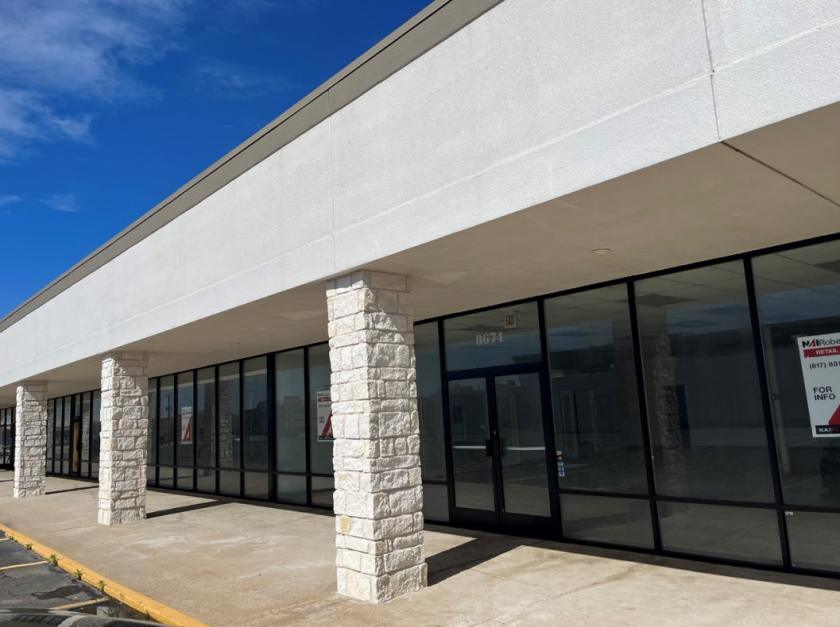
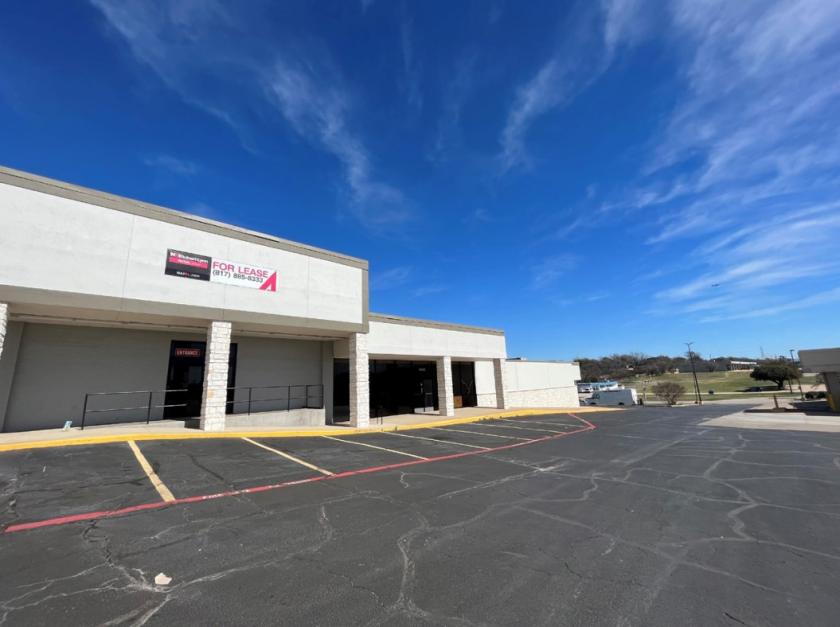
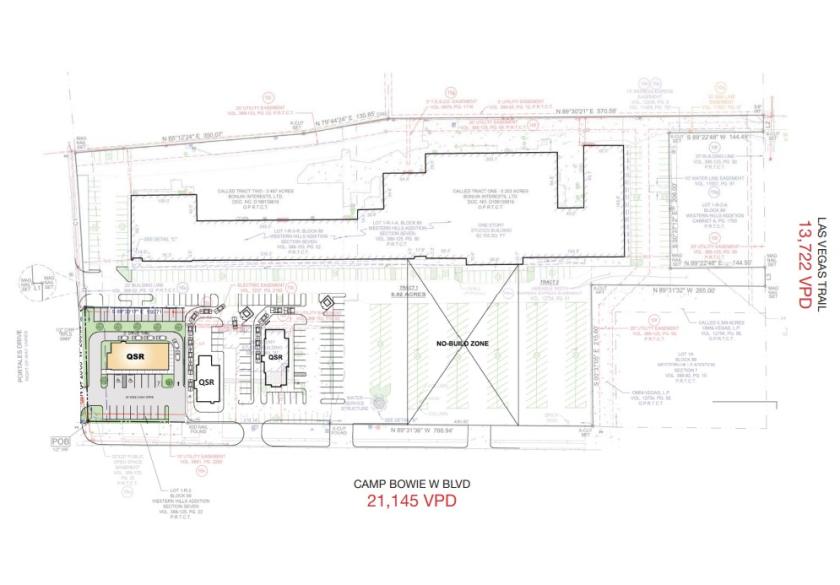
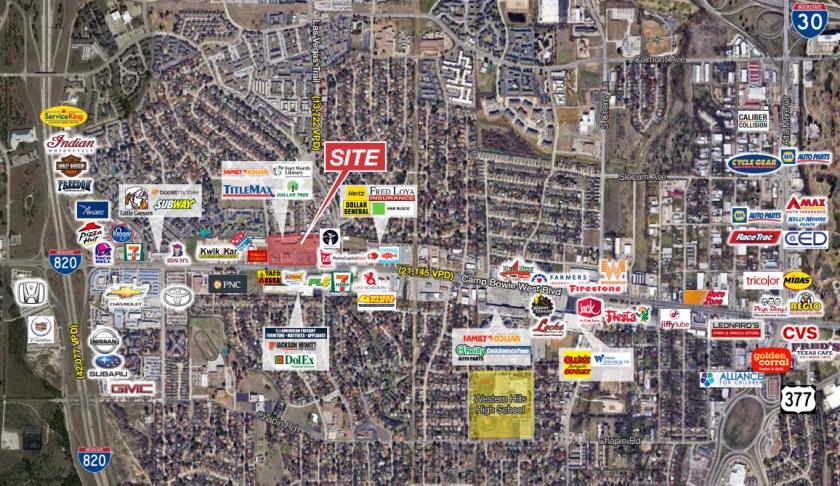
• Prime Frontage & Visibility to Camp Bowie West Blvd
• Lighted Intersections & Easy Access to the Center
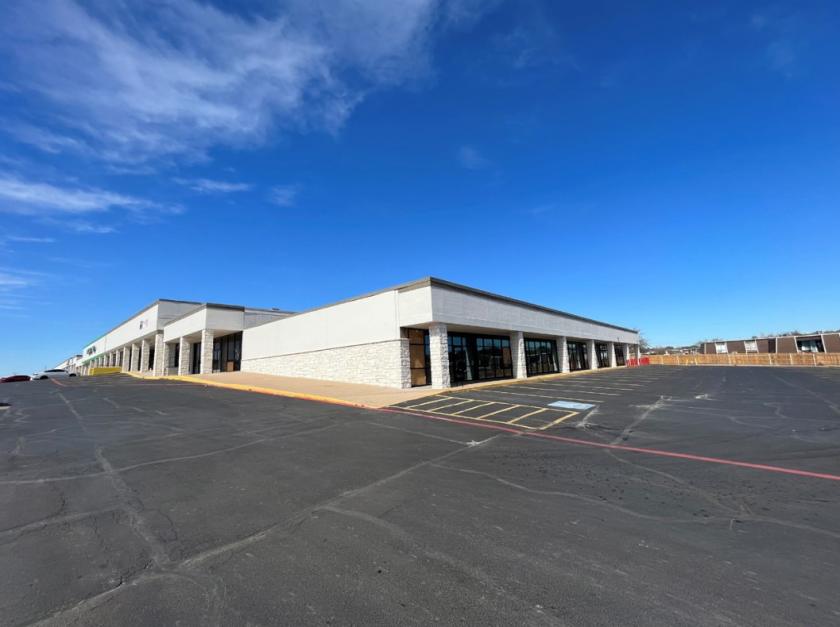
Additional Photos
Listing Agents
Jake Blankenship
O: 817-872-3904
M: 512-415-4299
jblankenship@nairl.com
O: 817-872-3904
M: 512-415-4299
jblankenship@nairl.com
While we strive to provide the most accurate information, all listing information, and demographic data, is provided by third-parties. As such, MyEListing will not be responsible for the accuracy of the information. It is strongly recommended that you verify all information with the listing agent, and any relevant agencies, prior to making any decisions.