Retail Space
11500 Lago Vista East Farmers Branch, TX 75234
11500 Lago Vista East Farmers Branch, TX 75234
Details & Description
Property Highlights
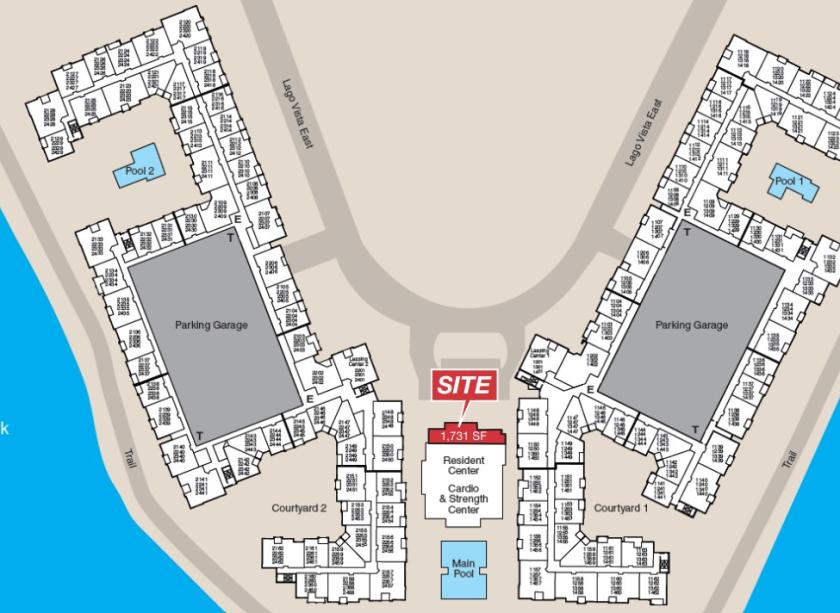
• Suite is Part of Multifamily Development with Shared Common Space with the Development Pool
• Unique 2nd Generation Restaurant Space Available
Listing Agents

Ryan Lee
O: 214-256-7143
M: 972-571-4296
rlee@nairl.com
O: 214-256-7143
M: 972-571-4296
rlee@nairl.com
While we strive to provide the most accurate information, all listing information, and demographic data, is provided by third-parties. As such, MyEListing will not be responsible for the accuracy of the information. It is strongly recommended that you verify all information with the listing agent, and any relevant agencies, prior to making any decisions.


