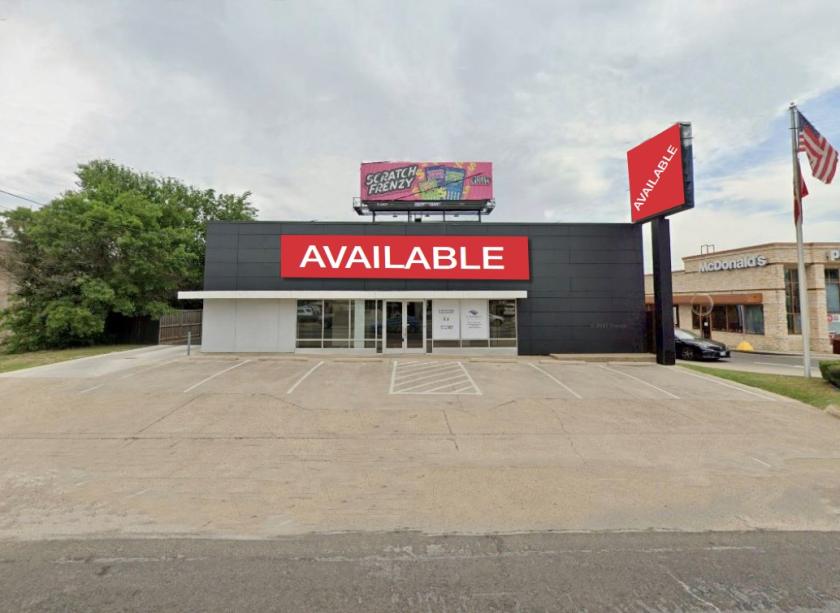
Retail Space
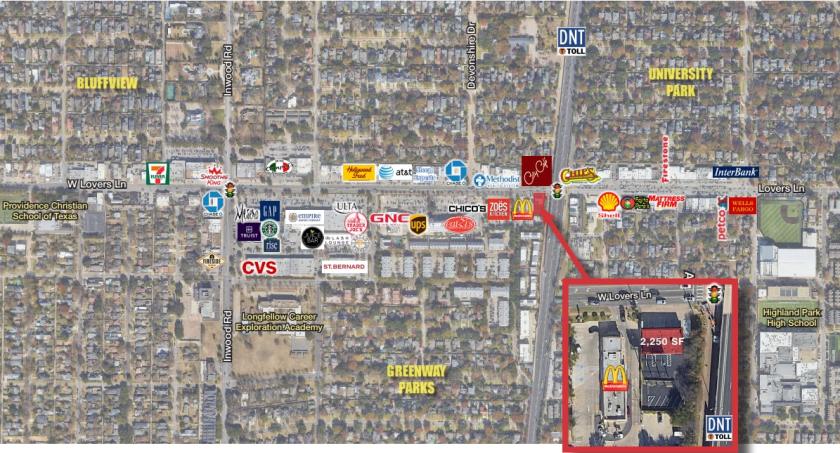
5730 West Lovers Lane Dallas, TX 75209
5730 West Lovers Lane Dallas, TX 75209
Details & Description
Property Highlights
- • 2nd Generation Medical
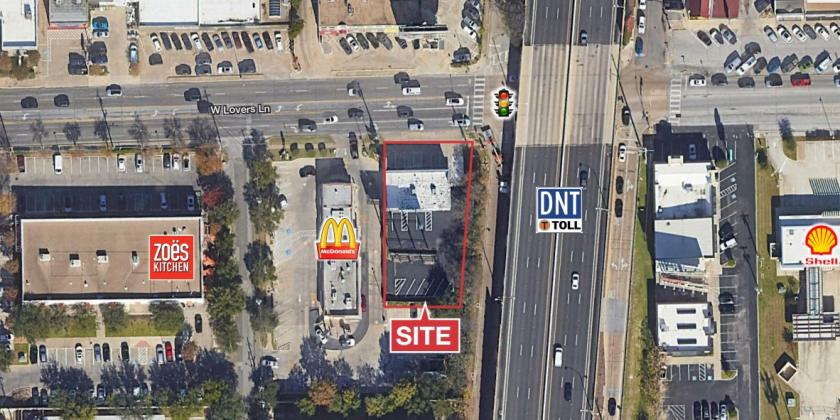
- • Excellent Visibility to All Traffic
- • Immediate Access to DNT
- • Sublease Through: 10/1/2031
Listing Agents

Ryan Libby
O: 214-256-7192
rlibby@nairl.com
O: 214-256-7192
rlibby@nairl.com

Stewart Korte
O: 214-256-7152
M: 210-827-2827
skorte@nairl.com
O: 214-256-7152
M: 210-827-2827
skorte@nairl.com
While we strive to provide the most accurate information, all listing information, and demographic data, is provided by third-parties. As such, MyEListing will not be responsible for the accuracy of the information. It is strongly recommended that you verify all information with the listing agent, and any relevant agencies, prior to making any decisions.