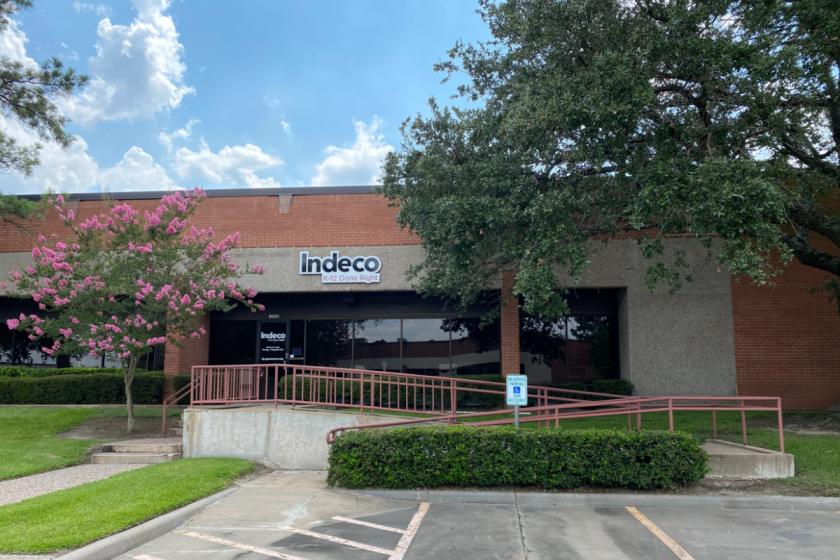
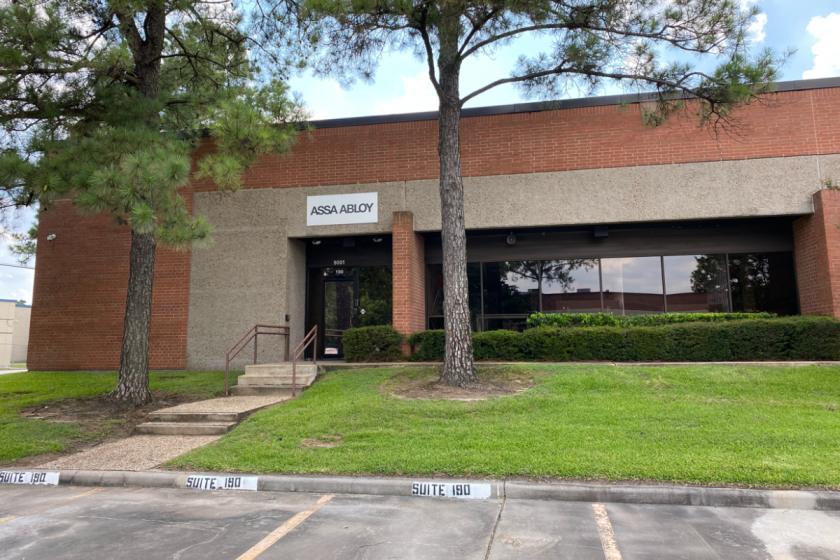
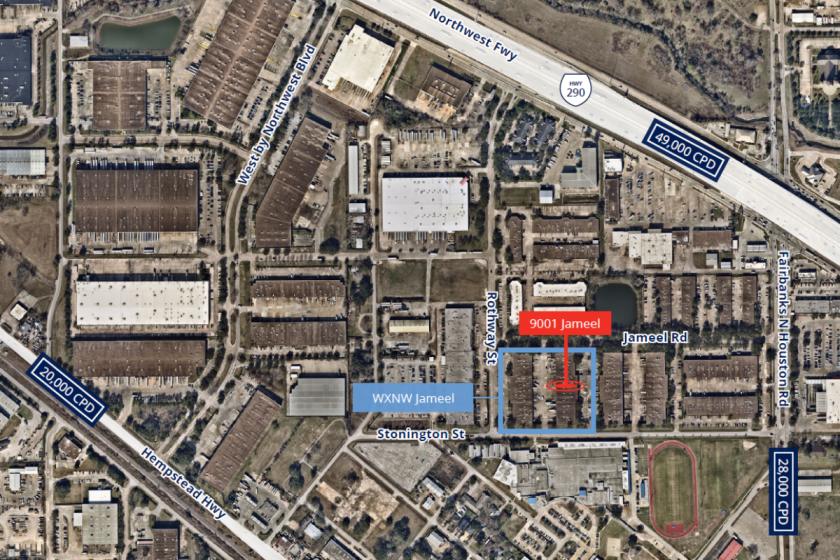
1-Mile | 3-Miles | 5-Miles | ||
---|---|---|---|---|
Total Population | 7,223 | 99,994 | 301,572 | |
Population Median Age | 33 | 35 | 35 | |
Population by Age | 0-9 Yrs | 1006 (13%) | 12897 (12%) | 42184 (13%) |
10-19 Yrs | 1234 (17%) | 14267 (14%) | 43129 (14%) | |
20-29 Yrs | 957 (13%) | 16212 (16%) | 46009 (15%) | |
30-39 Yrs | 1545 (21%) | 16825 (16%) | 47404 (15%) | |
40-49 Yrs | 617 (8%) | 12374 (12%) | 40180 (13%) | |
50-59 Yrs | 1000 (13%) | 12297 (12%) | 36033 (11%) | |
60-69 Yrs | 689 (9%) | 8579 (8%) | 27312 (9%) | |
70+ Yrs | 175 (2%) | 6542 (6%) | 19321 (6%) | |
Median HH Income | $42,248 | $55,895 | $56,330 | |
Total Household Income | < 24K | 774 (29%) | 6117 (17%) | 20321 (19%) |
25-49K | 739 (28%) | 9474 (27%) | 26473 (25%) | |
50-74K | 427 (16%) | 6295 (18%) | 17869 (17%) | |
75-99K | 246 (9%) | 4233 (12%) | 11804 (11%) | |
100-199K | 437 (16%) | 6746 (19%) | 20182 (19%) | |
200K+ | 11 (0%) | 1829 (5%) | 7216 (6%) | |
Highest Education Level | No Diploma | 1342 | 16420 | 45508 |
Diploma or GED | 1018 | 16212 | 49147 | |
Some College | 727 | 12260 | 36171 | |
Assoc. Degree | 618 | 4608 | 12615 | |
Bachelors Degree | 678 | 11146 | 35550 | |
Higher Degree | 223 | 4807 | 17069 | |
Total Housing Units | 2,792 | 36,961 | 112,665 | |
--Owner-Occupied | 579 | 17,805 | 53,408 | |
--Renter-Occupied | 2,055 | 16,889 | 50,456 | |
Owner-Occupied Values | < 100K | 200 | 2459 | 6954 |
100-199K | 200 | 8224 | 20545 | |
200-299K | 152 | 4501 | 12511 | |
300-399K | 5 | 1691 | 6775 | |
400-499K | 2 | 523 | 2756 | |
500K+ | 20 | 408 | 3867 | |
Total Working Age Population | 5,429 | 78,608 | 233,353 | |
In Work Force | 3,961 | 53,698 | 160,153 | |
Not In Work Force | 1,468 | 24,911 | 73,199 | |
Workforce Employed | 3,647 | 51,253 | 151,189 | |
Workforce Unemployed | 314 | 2,445 | 8,925 | |
Civlian Workforce | 3,961 | 53,697 | 160,115 | |
Military Workforce | 0 | 0 | 39 | |
Total Households | 2,634 | 34,694 | 103,864 | |
Family Households | 1,381 | 22,841 | 71,337 | |
Non-Family Households | 1,253 | 11,854 | 32,527 | |
Married Couple | 860 | 14,481 | 46,596 | |
Other Family | 521 | 8,359 | 24,741 | |
Married w/Child | 570 | 6,745 | 21,507 | |
Single Male w/Child | 84 | 1,188 | 3,228 | |
Single Female w/Child | 290 | 3,361 | 9,148 |
Population Change Last Two Decades - Plus Projection
2000 | % | 2010 | % | 2020 | % | 2030 | |
---|---|---|---|---|---|---|---|
Texas | 20,851,820 | +21 | 25,145,561 | +18 | 29,677,668 | +18 | 34,894,452 |
Harris County | 3,400,578 | +20 | 4,092,459 | +22 | 4,978,845 | +19 | 5,924,750 |
Total Working Age Population:
Total Households:
Total Working Age Population:
Total Households:
Total Working Age Population:
Total Households: