Industrial Properties
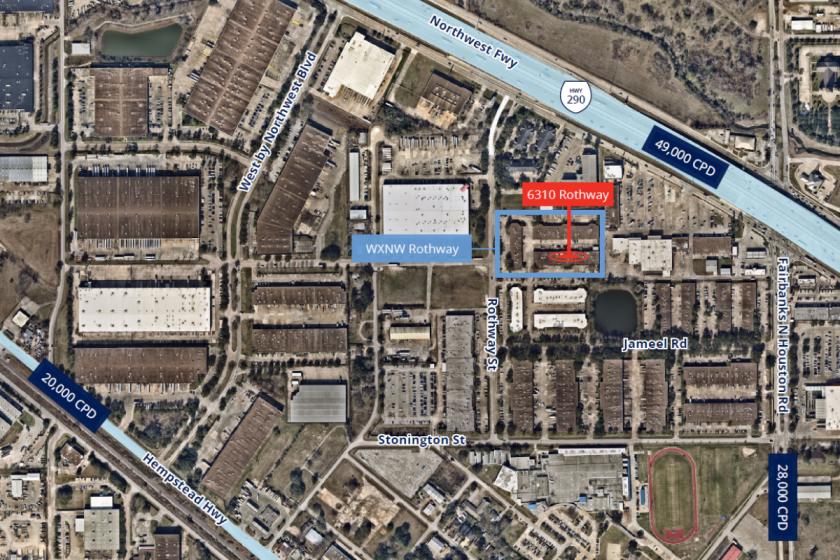
6310 Rothway Street Houston, TX 77040
6310 Rothway Street Houston, TX 77040

Details & Description
Property Highlights
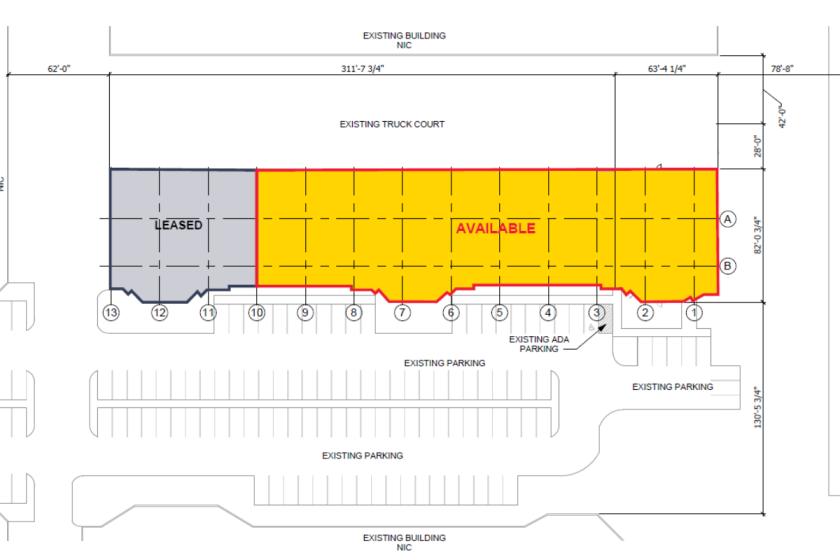
- • 29,230 SF total
- • Divisible (min. 5,000 SF)
- • Mix of private offices and open office
- • 59’ x 81’ Warehouse
- • 12’ Clear height
- • Large breakroom with kitchen
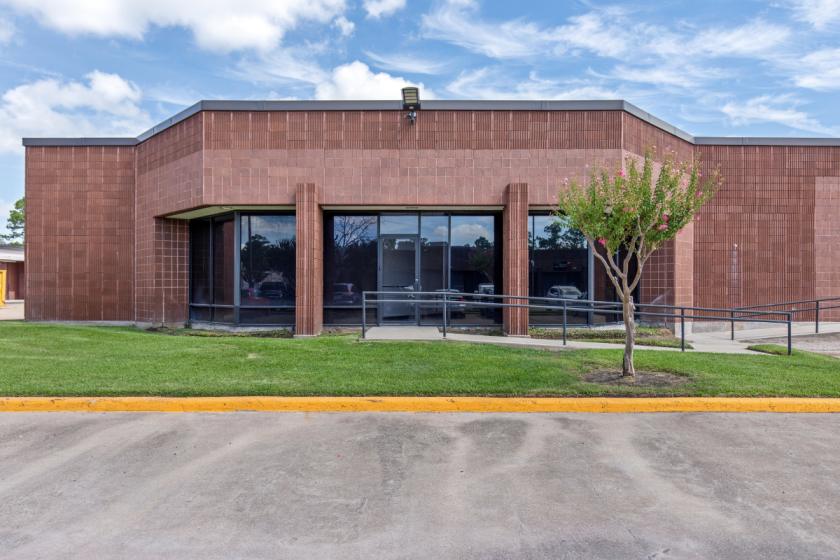
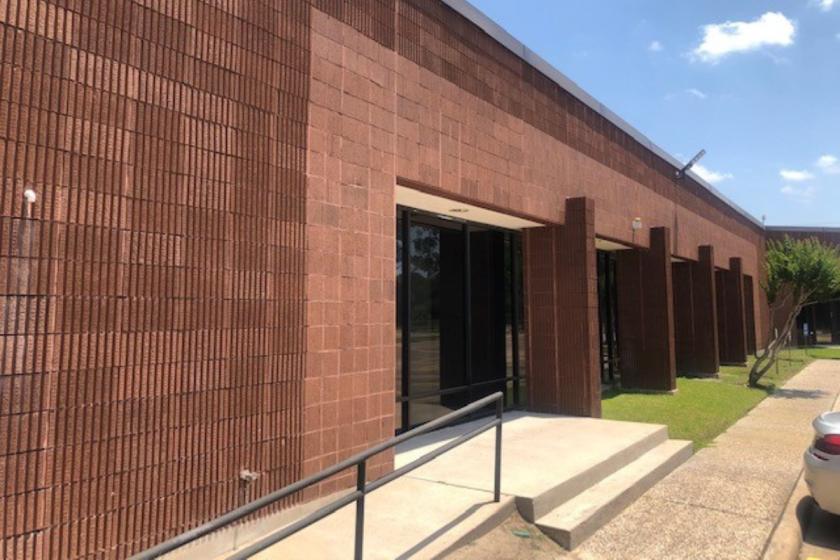
Additional Photos


Listing Agents

Ben Condara
O: 713-830-2155
M: 832-407-8711
ben.condara@colliers.com
O: 713-830-2155
M: 832-407-8711
ben.condara@colliers.com
While we strive to provide the most accurate information, all listing information, and demographic data, is provided by third-parties. As such, MyEListing will not be responsible for the accuracy of the information. It is strongly recommended that you verify all information with the listing agent, and any relevant agencies, prior to making any decisions.