Retail Space
SWC Westport Pkwy and I-35W Fort Worth, TX 76177
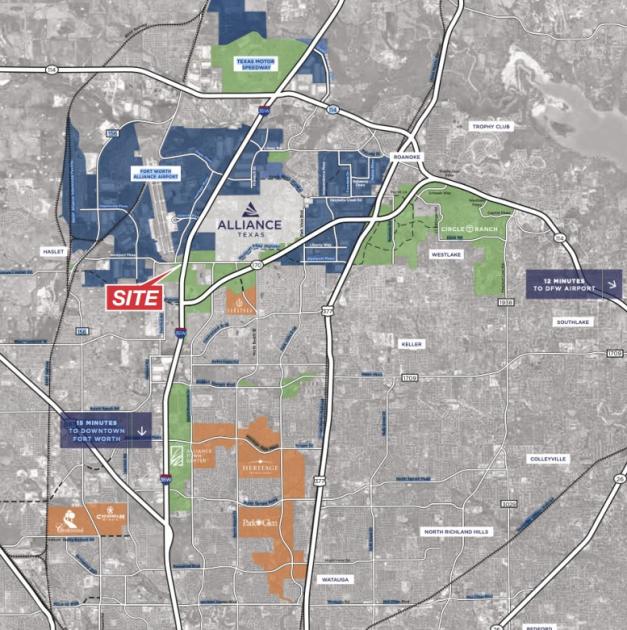
SWC Westport Pkwy and I-35W Fort Worth, TX 76177

Details & Description
Property Highlights
- • End Cap with Drive Thru
- • Signalized Intersection & Dedicated Turn Lane
- • I-35W Frontage
- • 2-Minutes to Fort Worth Alliance Airport
- • 5-Minutes to BNSF Alliance Intermodal Facility
- • Access to Hwy 170 (Expanding to 4 Lanes)
Listing Agents

Hunter Hayes
O: 817-872-3911
M: 817-487-7200
hhayes@nairl.com
O: 817-872-3911
M: 817-487-7200
hhayes@nairl.com
While we strive to provide the most accurate information, all listing information, and demographic data, is provided by third-parties. As such, MyEListing will not be responsible for the accuracy of the information. It is strongly recommended that you verify all information with the listing agent, and any relevant agencies, prior to making any decisions.