Industrial Properties
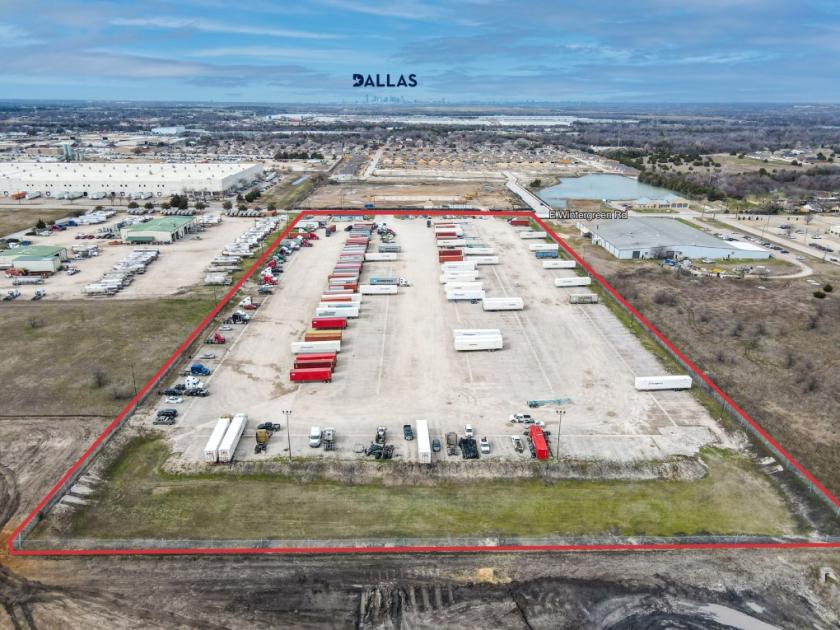
1300 East Wintergreen Road Hutchins, TX 75141
1300 East Wintergreen Road Hutchins, TX 75141

Details & Description
Property Highlights
• Easy Access to I-45 & I-20. Located One Mile North of UP Intermodal Entrance
• Fenced & Lit Outside Storage
Listing Agents

Matt Elliott
O: 214-256-7161
M: 214-256-7161
melliott@nairl.com
O: 214-256-7161
M: 214-256-7161
melliott@nairl.com

Rick Medinis
O: 214-543-1248
M: 214-256-7116
rmedinis@nairl.com
O: 214-543-1248
M: 214-256-7116
rmedinis@nairl.com
While we strive to provide the most accurate information, all listing information, and demographic data, is provided by third-parties. As such, MyEListing will not be responsible for the accuracy of the information. It is strongly recommended that you verify all information with the listing agent, and any relevant agencies, prior to making any decisions.