Retail Space
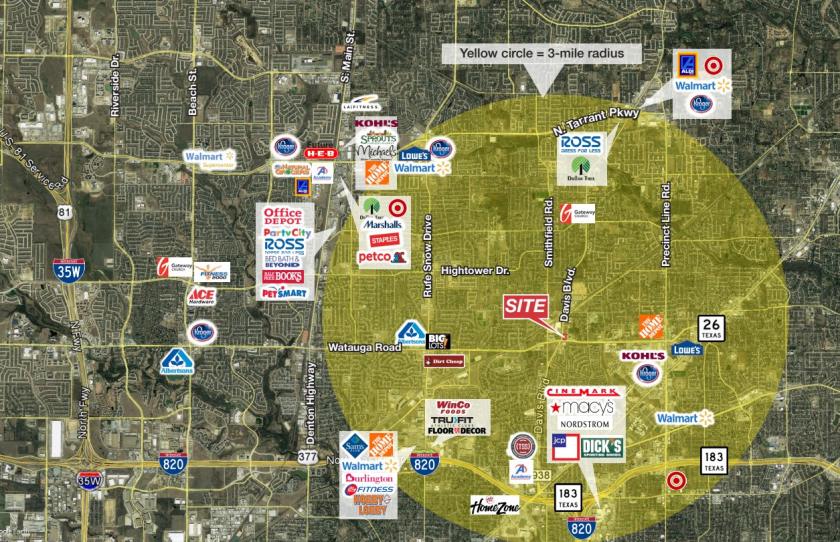
6360 Davis Boulevard North Richland Hills, TX 76180
6360 Davis Boulevard North Richland Hills, TX 76180
Details & Description
Property Highlights
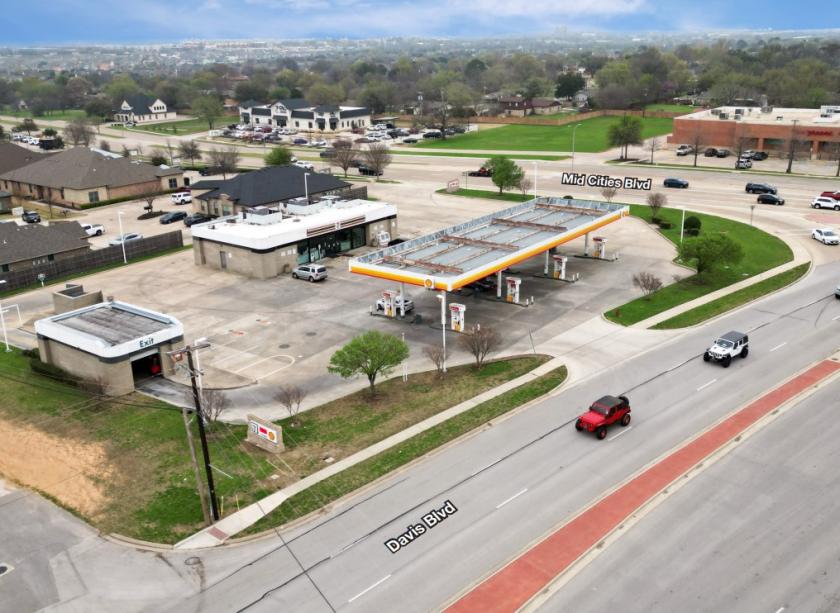
- • Hard Corner Development Opportunity
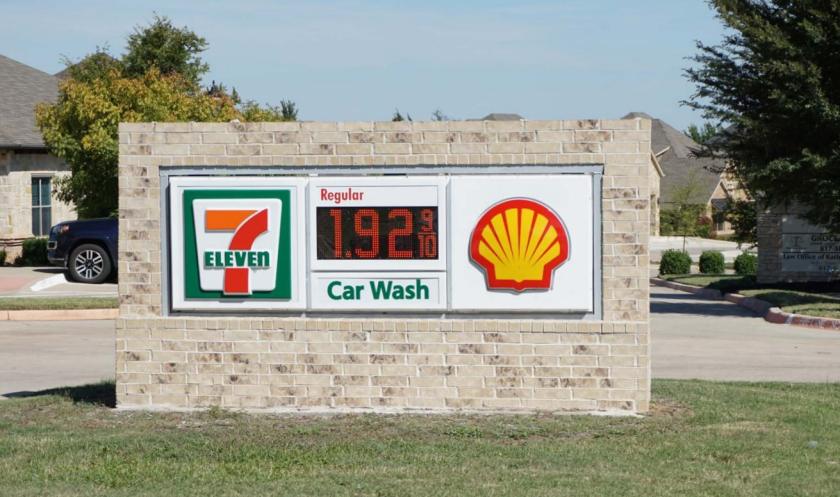
- • 7/11 to Remove Tanks
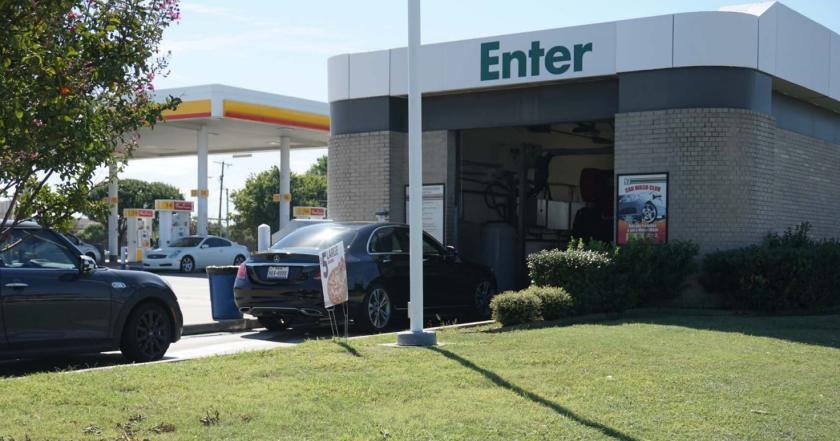
- • Multiple Ingress/Egress Points
- • At Signalized Intersection
- • Two (2) Pad Site Opportunities
Additional Photos
Listing Agents

Hunter Hayes
O: 817-872-3911
M: 817-487-7200
hhayes@nairl.com
O: 817-872-3911
M: 817-487-7200
hhayes@nairl.com

Tommy Tran
O: 214-256-7195
M: 817-371-5613
ttran@nairl.com
O: 214-256-7195
M: 817-371-5613
ttran@nairl.com
While we strive to provide the most accurate information, all listing information, and demographic data, is provided by third-parties. As such, MyEListing will not be responsible for the accuracy of the information. It is strongly recommended that you verify all information with the listing agent, and any relevant agencies, prior to making any decisions.