Retail Space
3034 Western Center Boulevard Fort Worth, TX 76131
3034 Western Center Boulevard Fort Worth, TX 76131
Details & Description
Property Highlights
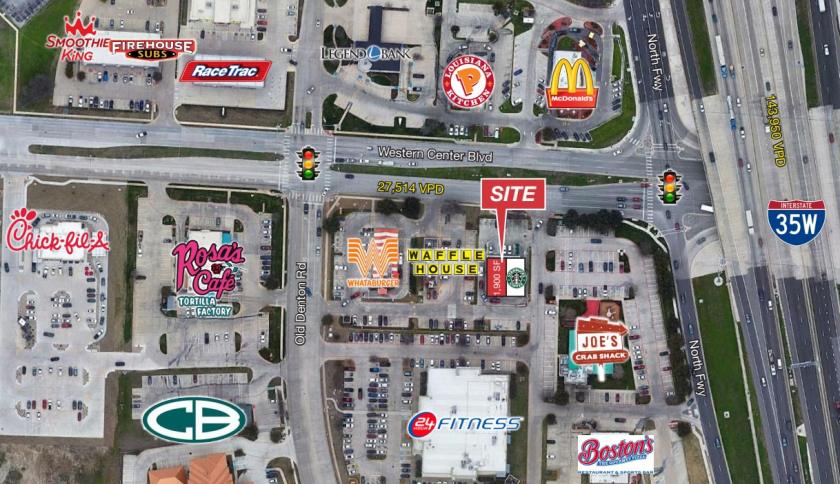
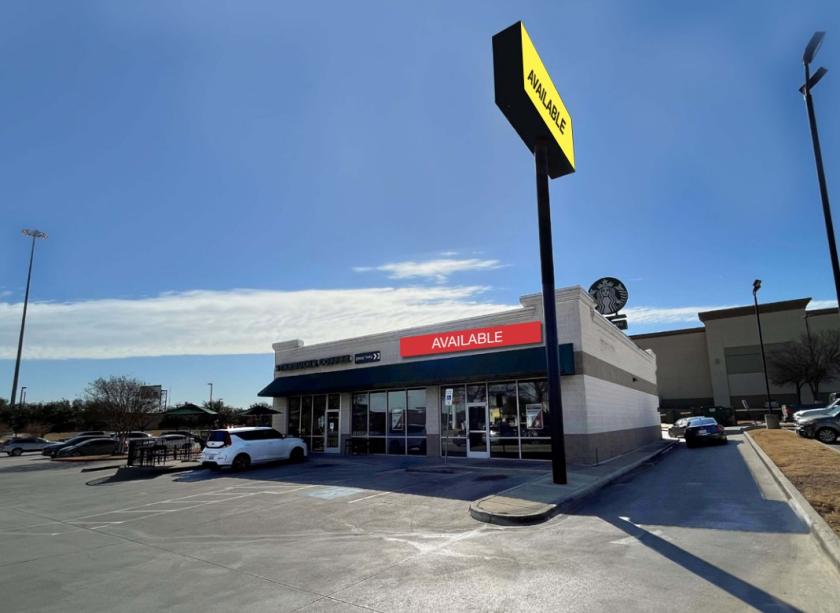
- • Starbucks Anchored Center
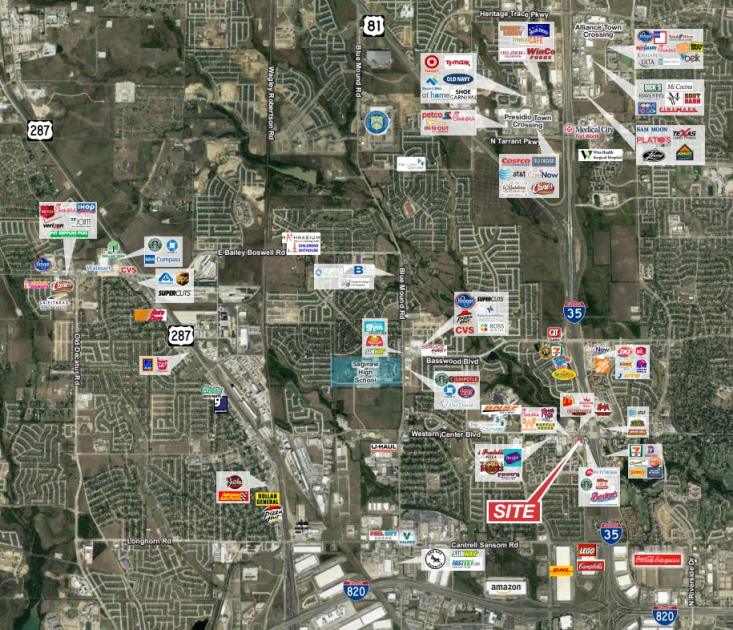
- • Located at Western Center Blvd & I-35
- • Excellent Visibility to I-35
- • Pylon Signage Available with Interstate Visibility
Listing Agents
Jake Blankenship
O: 817-872-3904
M: 512-415-4299
jblankenship@nairl.com
O: 817-872-3904
M: 512-415-4299
jblankenship@nairl.com
While we strive to provide the most accurate information, all listing information, and demographic data, is provided by third-parties. As such, MyEListing will not be responsible for the accuracy of the information. It is strongly recommended that you verify all information with the listing agent, and any relevant agencies, prior to making any decisions.