Industrial Properties
3101 Dallas Fort Worth Turnpike Dallas, TX 75212
3101 Dallas Fort Worth Turnpike Dallas, TX 75212
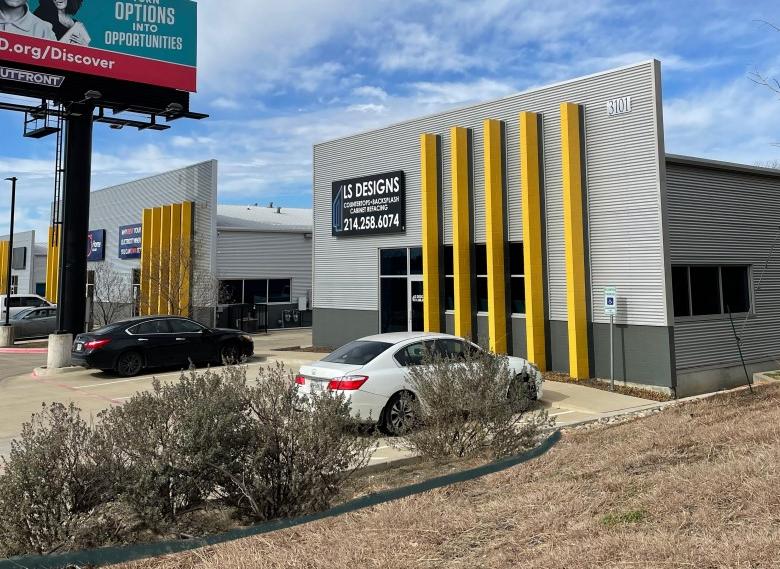
Details & Description
Property Highlights
- • New Construction Property
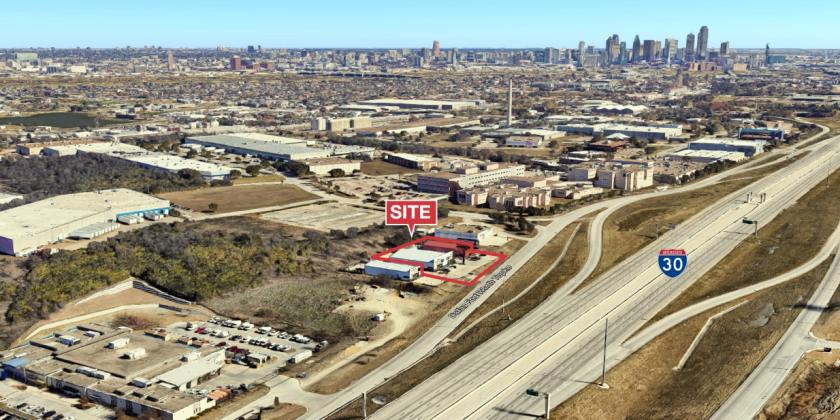
- • Front Highway Access
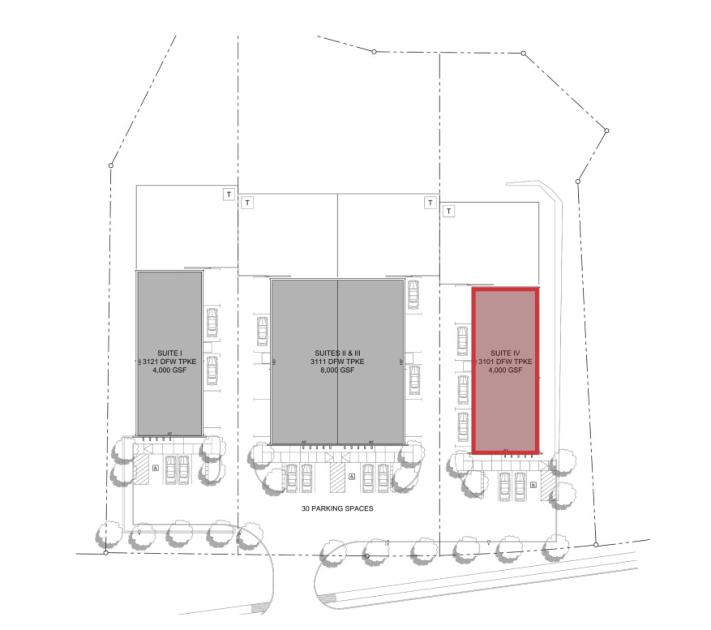
- • 30 Parking Spaces
- • 7 Miles to Dallas Love Field
- • 19 Miles to DFW International Airport
- • 16’ Clear Height
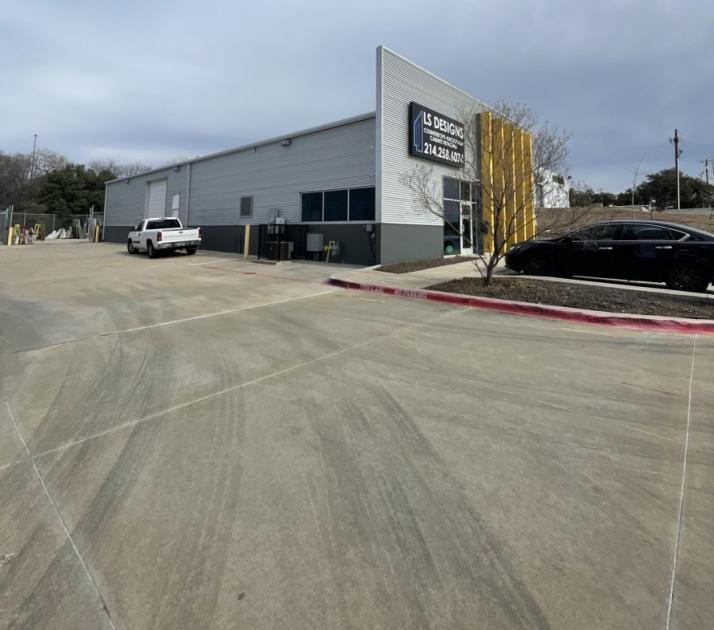
Additional Photos
Listing Agents

Justin Glover
O: 817-872-3921
M: 832-630-8003
jglover@nairl.com
O: 817-872-3921
M: 832-630-8003
jglover@nairl.com
While we strive to provide the most accurate information, all listing information, and demographic data, is provided by third-parties. As such, MyEListing will not be responsible for the accuracy of the information. It is strongly recommended that you verify all information with the listing agent, and any relevant agencies, prior to making any decisions.


