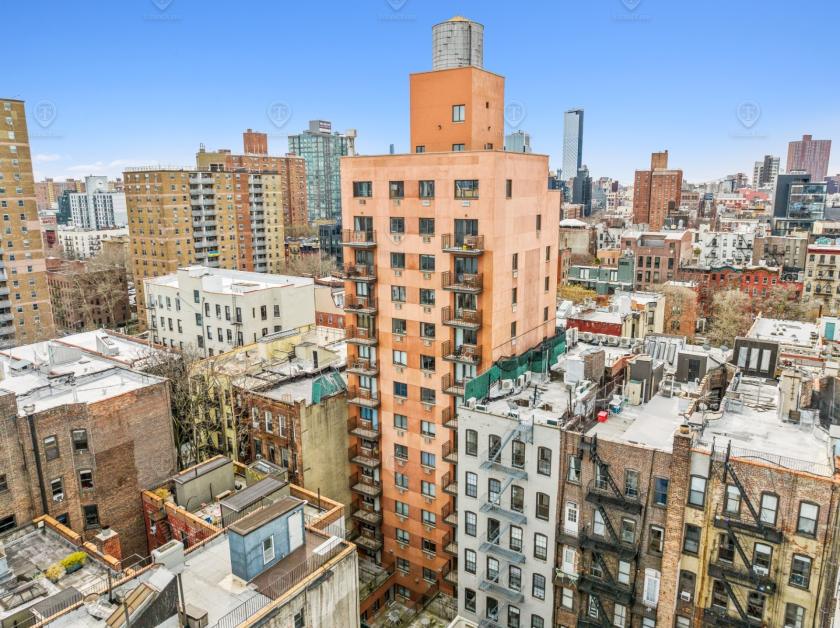
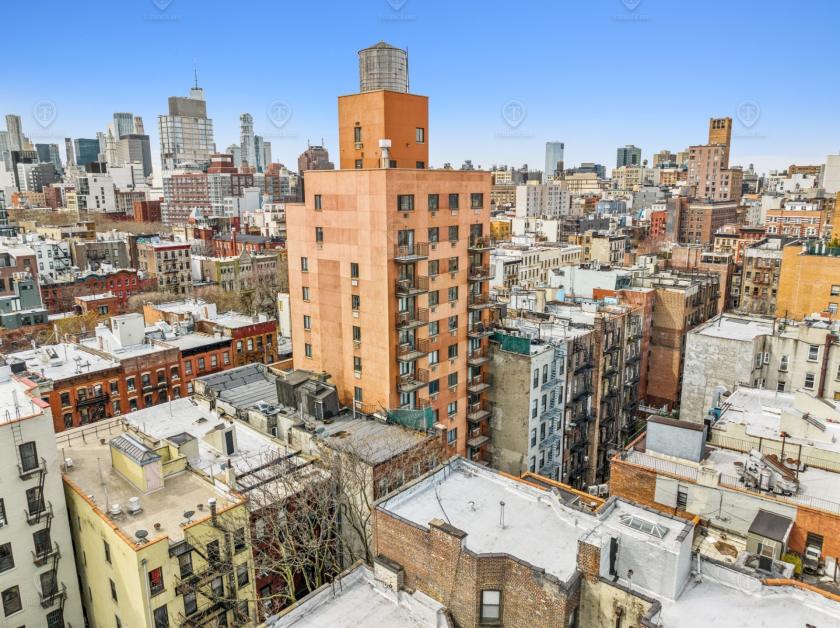
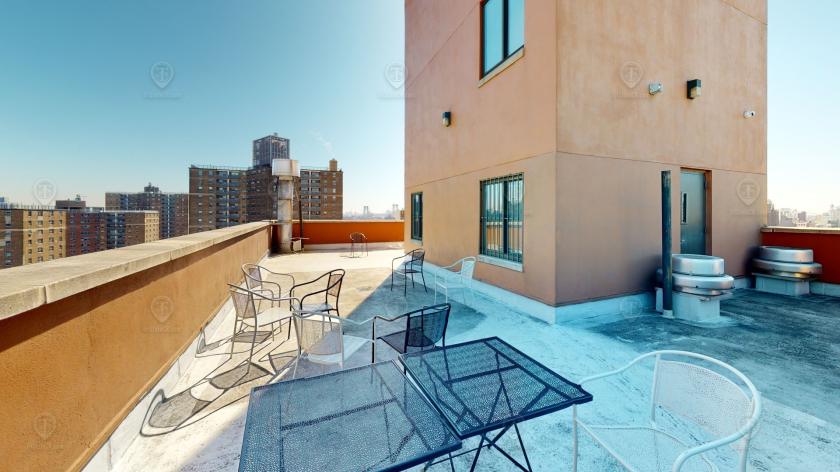
Specialty Real Estate
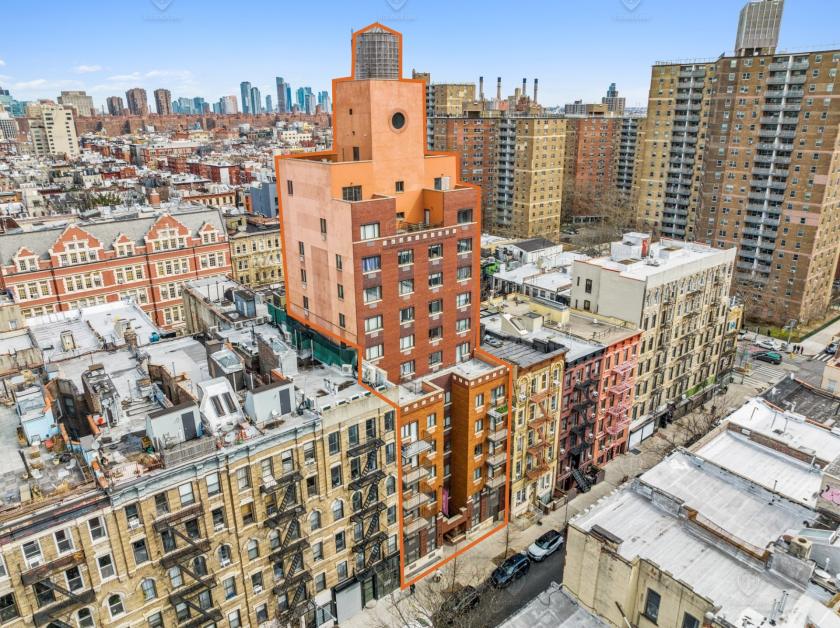
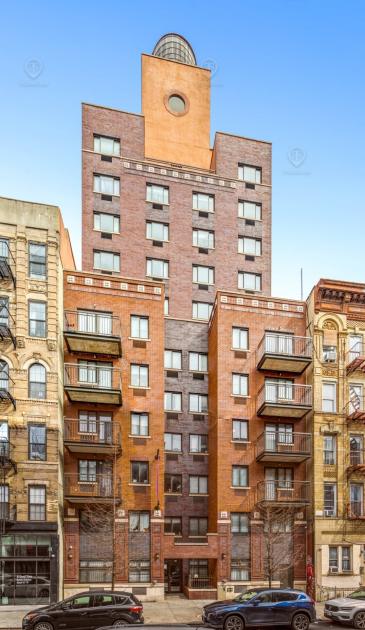
81 East 3rd Street New York, NY 10003
81 East 3rd Street New York, NY 10003
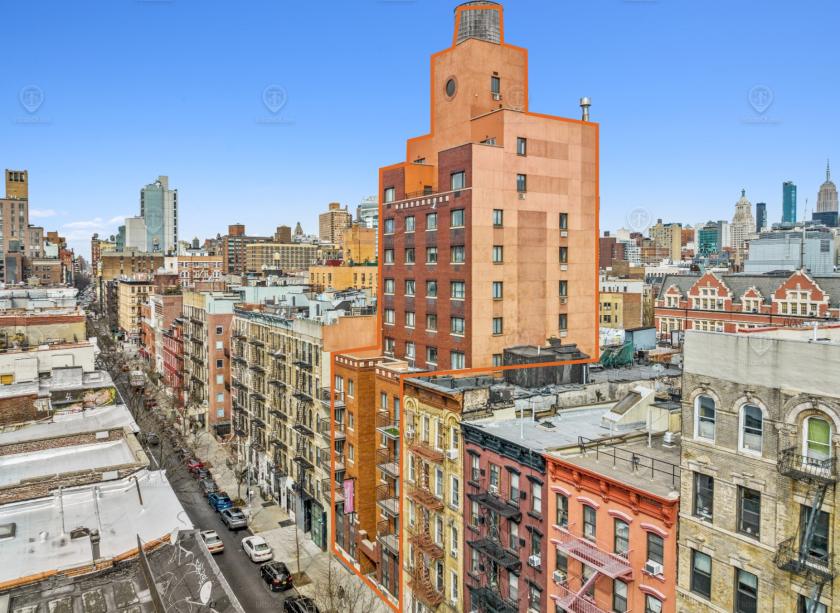
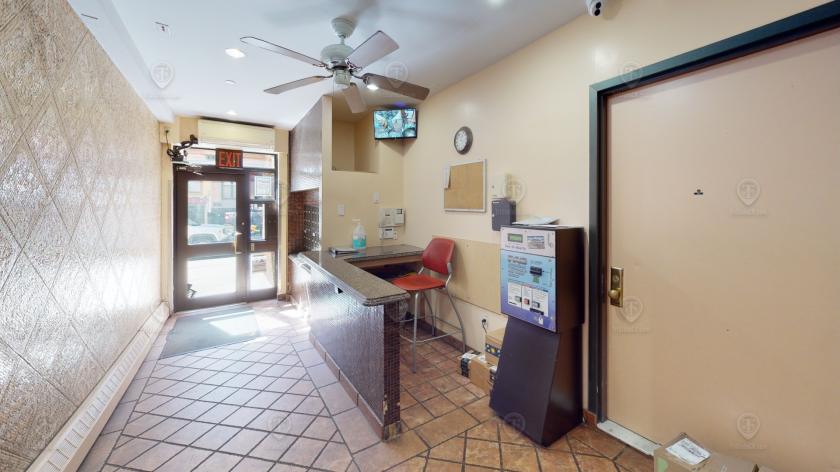
Details & Description
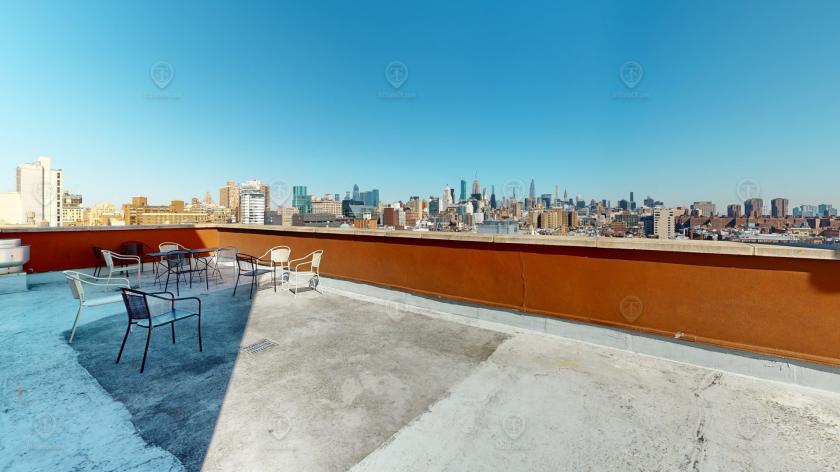
Property Highlights
- • 12 floors
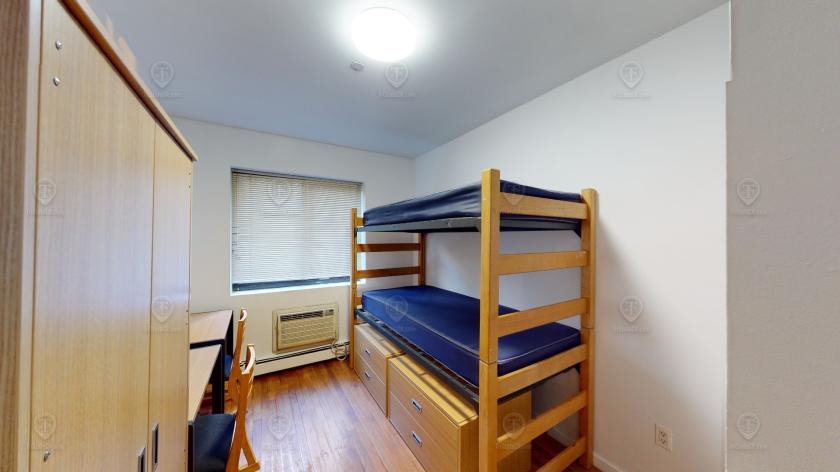
- • 190 - 220 bed dormitory
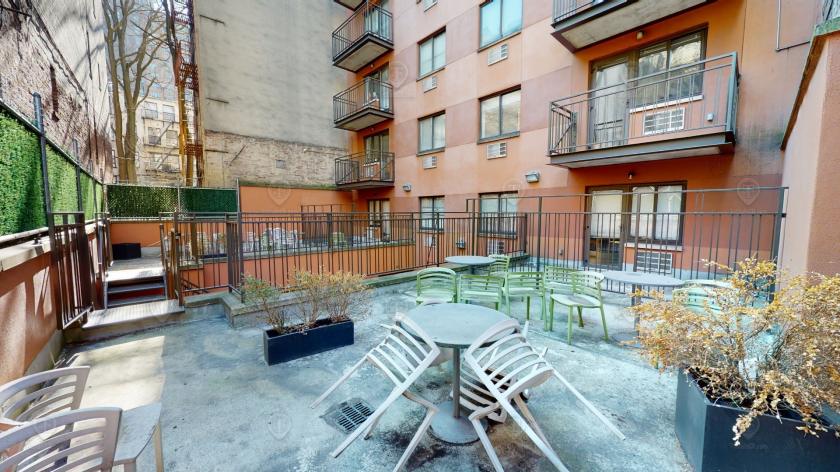
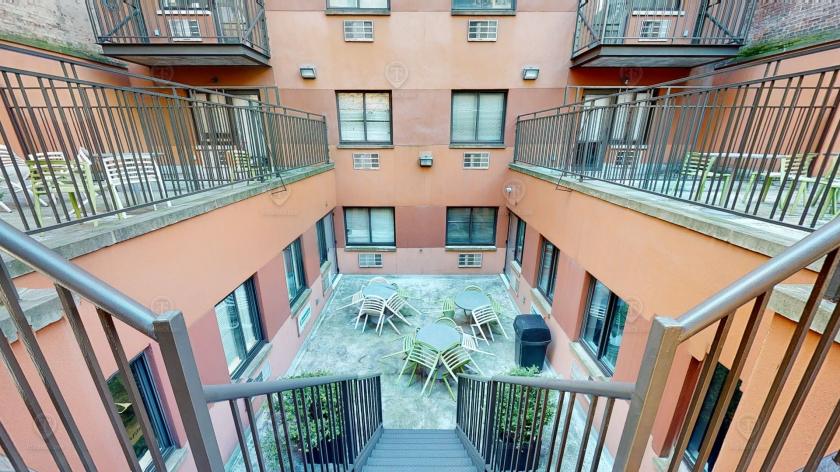
- • Rear courtyard
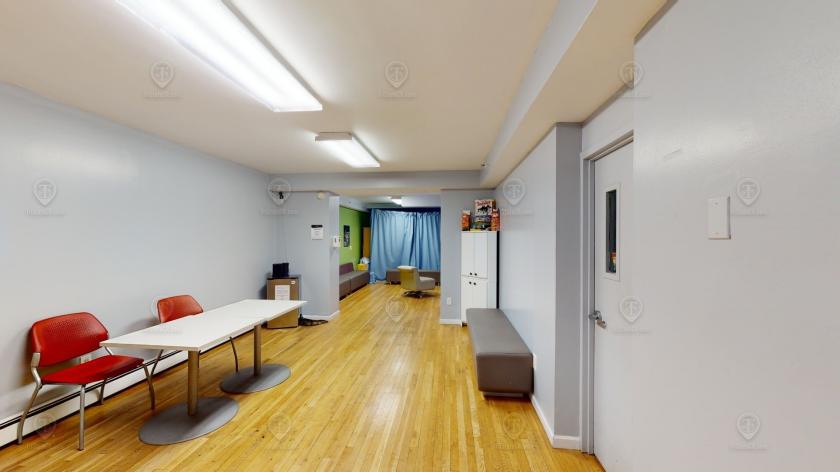
- • Common recreation room
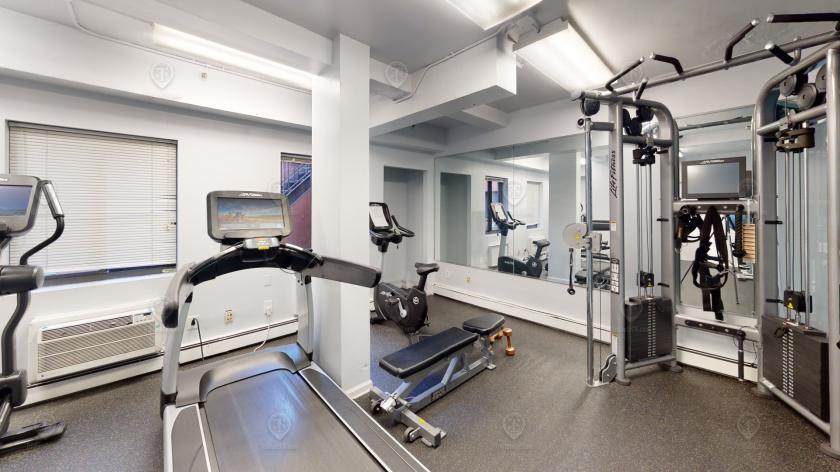
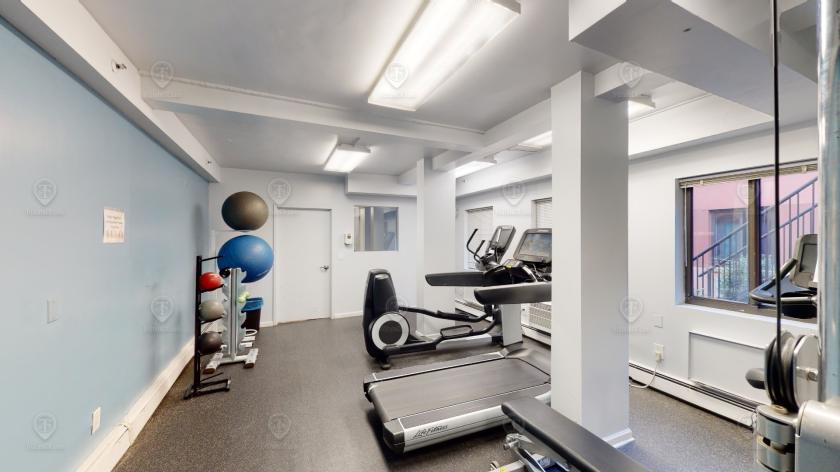
- • In-building gym
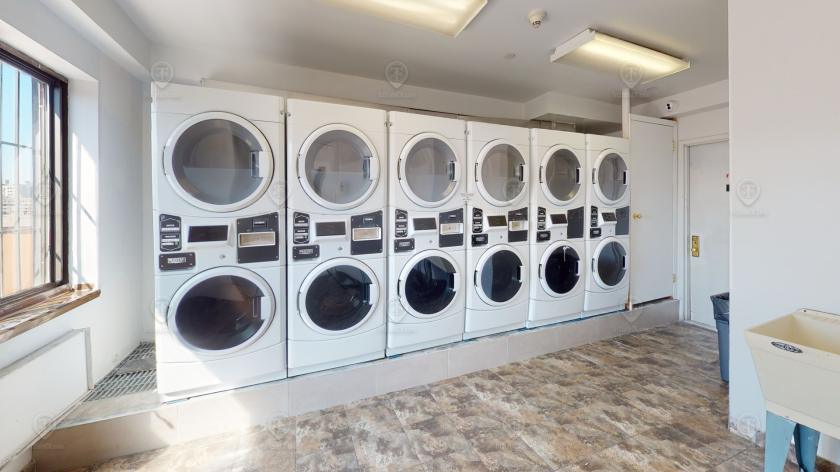
- • In-building laundry
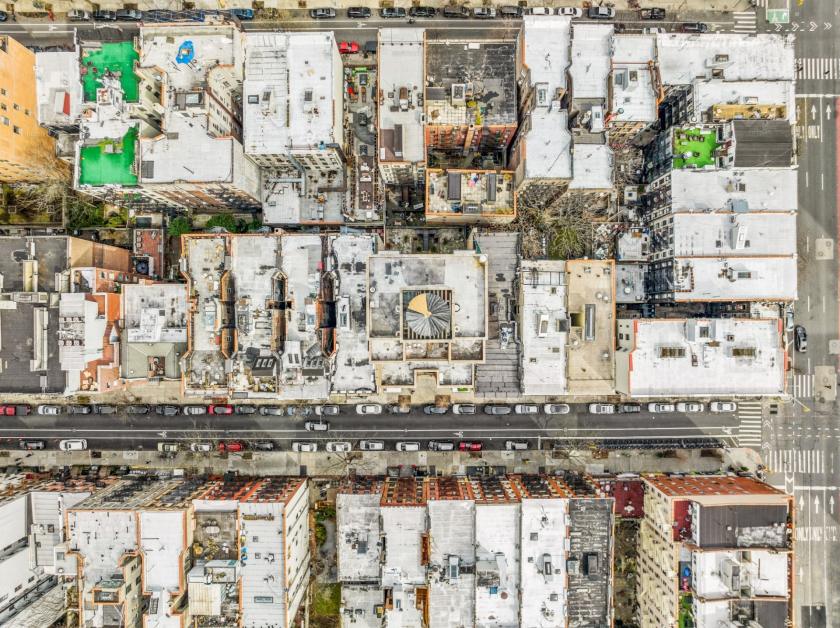
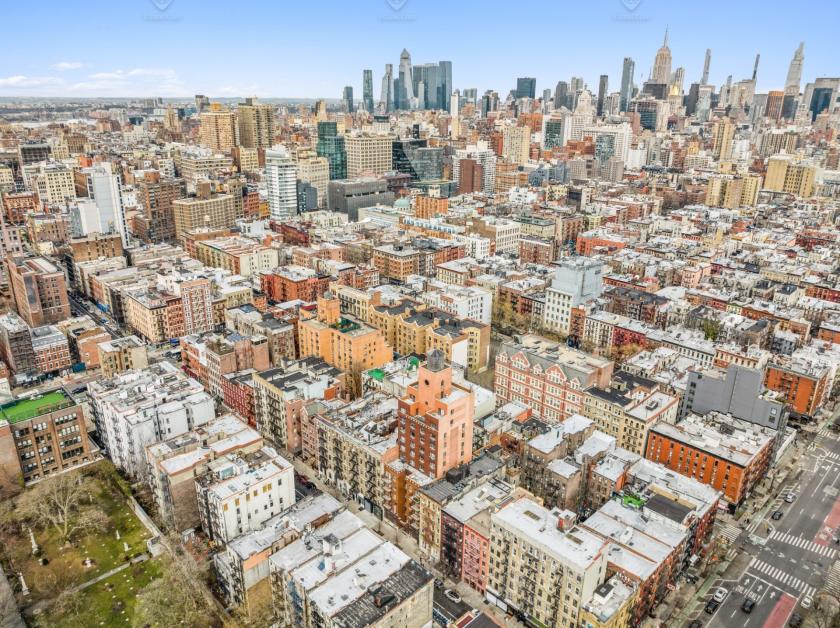
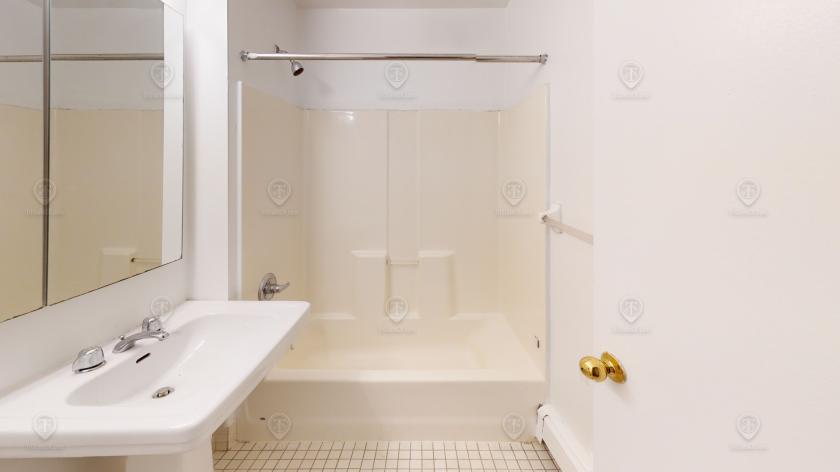
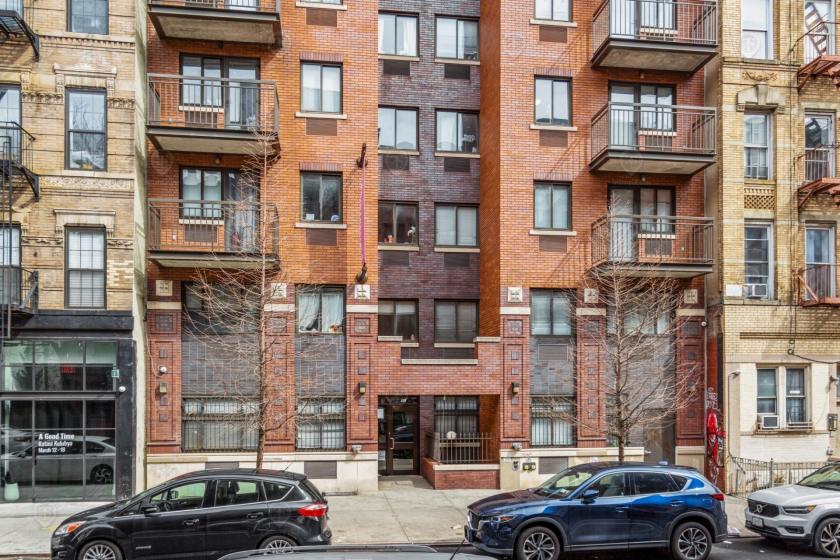
Additional Photos

Listing Agents

Shlomi Bagdadi
O: 718-437-6100
info@tristatecr.com
O: 718-437-6100
info@tristatecr.com
While we strive to provide the most accurate information, all listing information, and demographic data, is provided by third-parties. As such, MyEListing will not be responsible for the accuracy of the information. It is strongly recommended that you verify all information with the listing agent, and any relevant agencies, prior to making any decisions.