Office Space
4841 Memphis Street Dallas, TX 75207
4841 Memphis Street Dallas, TX 75207

Details & Description
Property Highlights
- • Secured Parking
- • Fiber Optics to Building
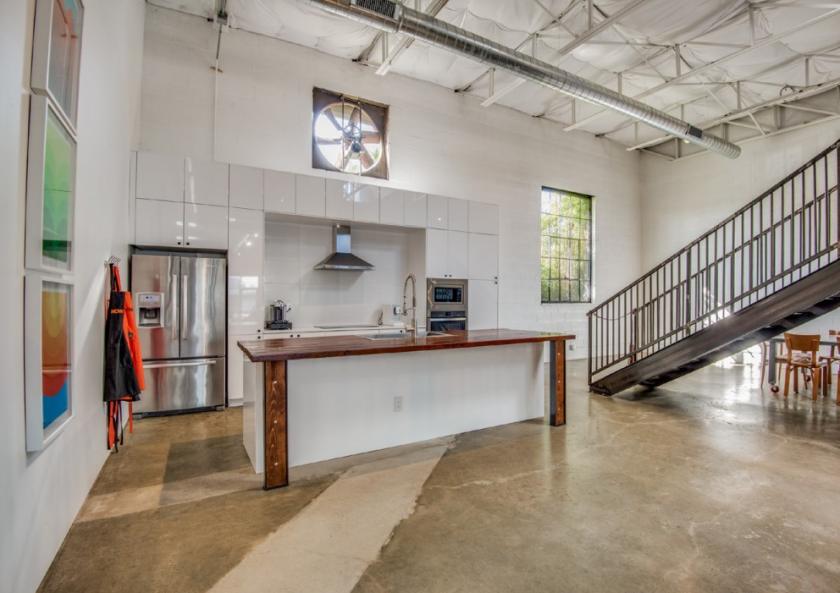
- • Potential Work/Live
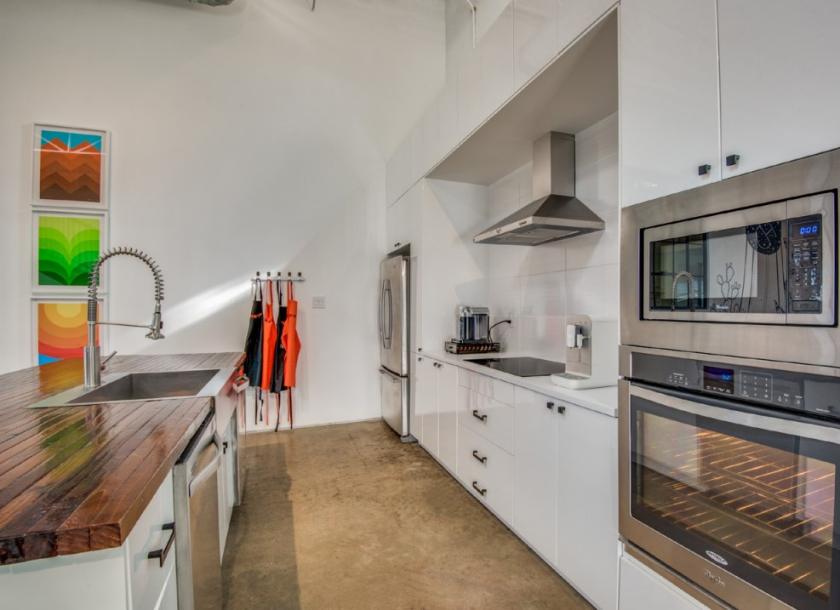
- • 2 Full Kitchens
Additional Photos


Listing Agents

Chase Miller
O: 214-256-7131
M: 214-770-5495
cmiller@nairl.com
O: 214-256-7131
M: 214-770-5495
cmiller@nairl.com
Robert Blankinship
O: 214-256-7115
M: 214-500-6326
rblankinship@nairl.com
O: 214-256-7115
M: 214-500-6326
rblankinship@nairl.com
While we strive to provide the most accurate information, all listing information, and demographic data, is provided by third-parties. As such, MyEListing will not be responsible for the accuracy of the information. It is strongly recommended that you verify all information with the listing agent, and any relevant agencies, prior to making any decisions.