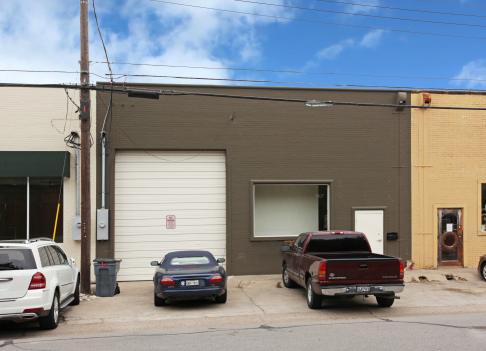
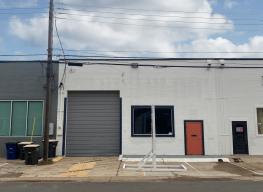
1-Mile | 3-Miles | 5-Miles | ||
---|---|---|---|---|
Total Population | 14,489 | 152,667 | 353,506 | |
Population Median Age | 36 | 36 | 36 | |
Population by Age | 0-9 Yrs | 573 (3%) | 10354 (6%) | 38211 (10%) |
10-19 Yrs | 508 (3%) | 10341 (6%) | 38037 (10%) | |
20-29 Yrs | 5180 (35%) | 43622 (28%) | 75585 (21%) | |
30-39 Yrs | 3593 (24%) | 33661 (22%) | 63724 (18%) | |
40-49 Yrs | 1625 (11%) | 19207 (12%) | 45518 (12%) | |
50-59 Yrs | 1423 (9%) | 17024 (11%) | 40614 (11%) | |
60-69 Yrs | 1018 (7%) | 10961 (7%) | 31482 (8%) | |
70+ Yrs | 568 (3%) | 7498 (4%) | 20336 (5%) | |
Median HH Income | $94,405 | $74,343 | $68,915 | |
Total Household Income | < 24K | 968 (11%) | 12267 (15%) | 27895 (18%) |
25-49K | 824 (9%) | 12795 (16%) | 27716 (18%) | |
50-74K | 1621 (19%) | 14709 (18%) | 26639 (17%) | |
75-99K | 935 (11%) | 10389 (13%) | 18080 (11%) | |
100-199K | 2591 (31%) | 19128 (24%) | 31611 (20%) | |
200K+ | 1338 (16%) | 9554 (12%) | 20938 (13%) | |
Highest Education Level | No Diploma | 1094 | 14472 | 44510 |
Diploma or GED | 1070 | 14556 | 40190 | |
Some College | 1421 | 17256 | 35491 | |
Assoc. Degree | 374 | 5149 | 10211 | |
Bachelors Degree | 4701 | 39710 | 71395 | |
Higher Degree | 2777 | 25830 | 45907 | |
Total Housing Units | 9,357 | 89,798 | 172,356 | |
--Owner-Occupied | 1,181 | 20,282 | 59,291 | |
--Renter-Occupied | 7,096 | 58,560 | 93,588 | |
Owner-Occupied Values | < 100K | 148 | 1482 | 9589 |
100-199K | 196 | 3746 | 11597 | |
200-299K | 184 | 2963 | 7396 | |
300-399K | 66 | 3089 | 6320 | |
400-499K | 92 | 2471 | 5404 | |
500K+ | 495 | 6530 | 18985 | |
Total Working Age Population | 13,584 | 135,888 | 292,316 | |
In Work Force | 10,849 | 102,678 | 207,394 | |
Not In Work Force | 2,735 | 33,209 | 84,922 | |
Workforce Employed | 10,620 | 98,409 | 197,098 | |
Workforce Unemployed | 228 | 4,242 | 10,162 | |
Civlian Workforce | 10,849 | 102,650 | 207,260 | |
Military Workforce | 0 | 28 | 134 | |
Total Households | 8,277 | 78,842 | 152,879 | |
Family Households | 2,073 | 25,805 | 69,917 | |
Non-Family Households | 6,204 | 53,037 | 82,961 | |
Married Couple | 1,462 | 18,246 | 48,180 | |
Other Family | 611 | 7,559 | 21,737 | |
Married w/Child | 181 | 4,726 | 18,326 | |
Single Male w/Child | 46 | 648 | 2,025 | |
Single Female w/Child | 240 | 3,039 | 8,292 |
Population Change Last Two Decades - Plus Projection
2000 | % | 2010 | % | 2020 | % | 2030 | |
---|---|---|---|---|---|---|---|
Texas | 20,851,820 | +21 | 25,145,561 | +18 | 29,677,668 | +18 | 34,894,452 |
Dallas County | 2,218,899 | +7 | 2,368,139 | +15 | 2,734,111 | +14 | 3,106,298 |
Total Working Age Population:
Total Households:
Total Working Age Population:
Total Households:
Total Working Age Population:
Total Households: