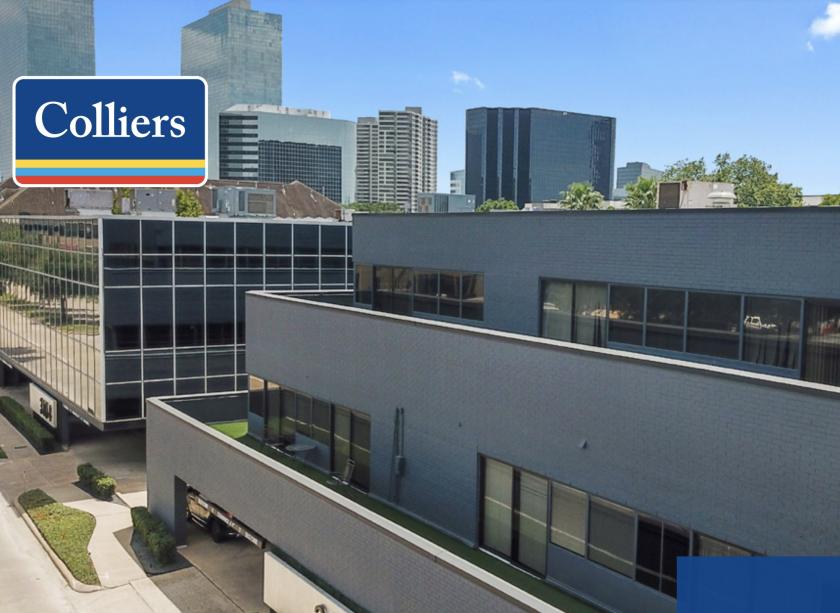
Office Space
3100 and 3104 Edloe Street Houston, TX 77027
3100 and 3104 Edloe Street Houston, TX 77027
Details & Description
Property Highlights
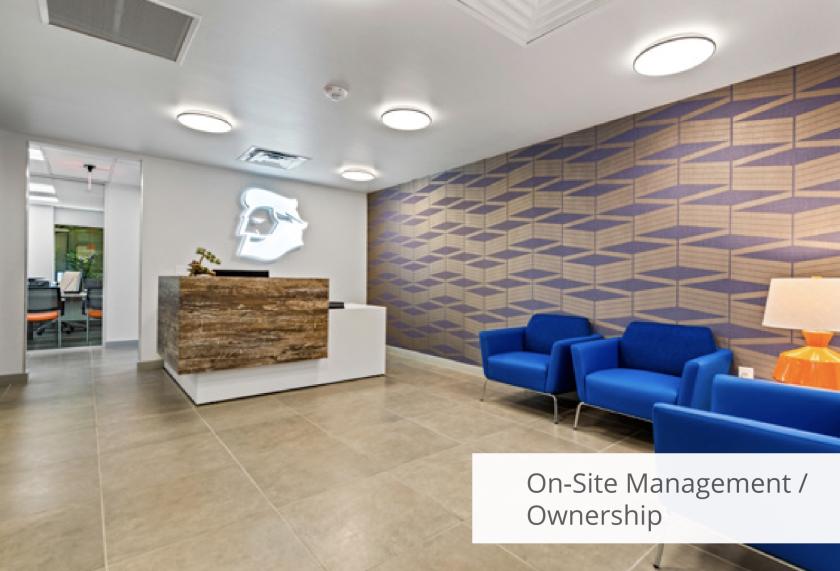
- • Onsite management and ownership
- • Controlled 24/7 access
- • Under building parking
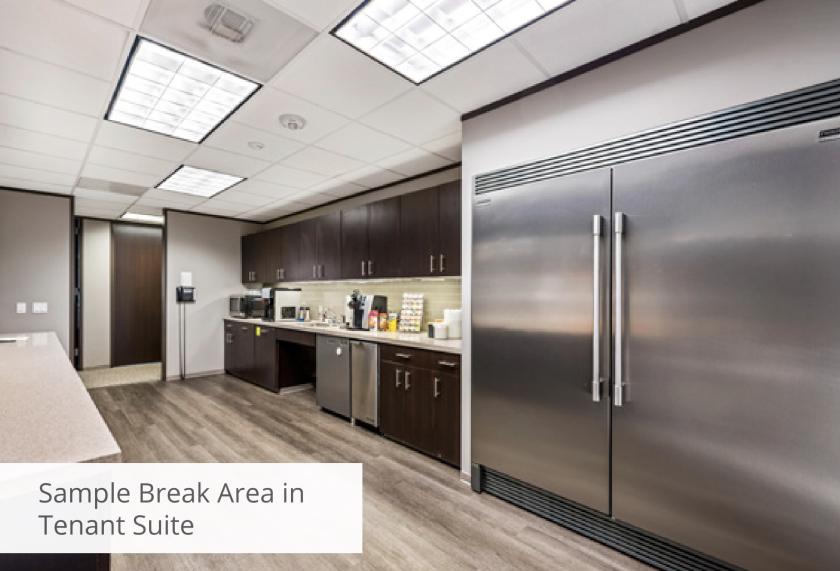
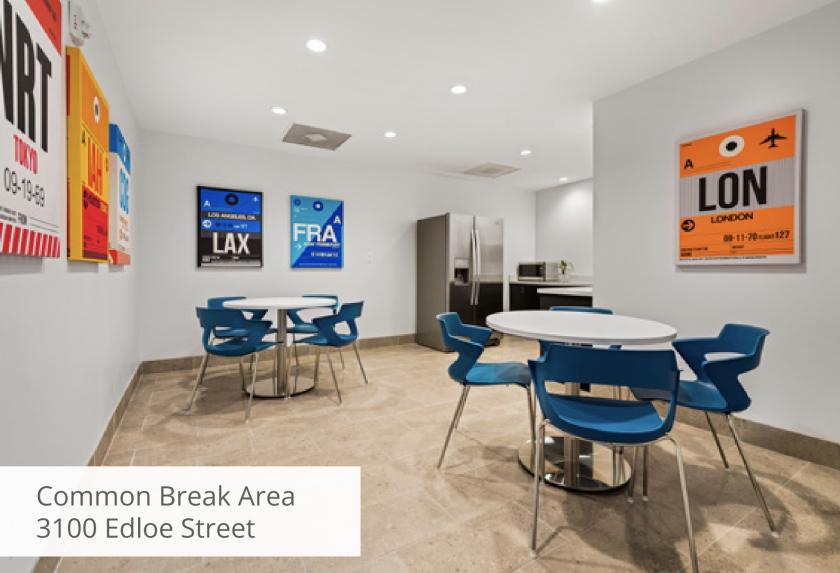
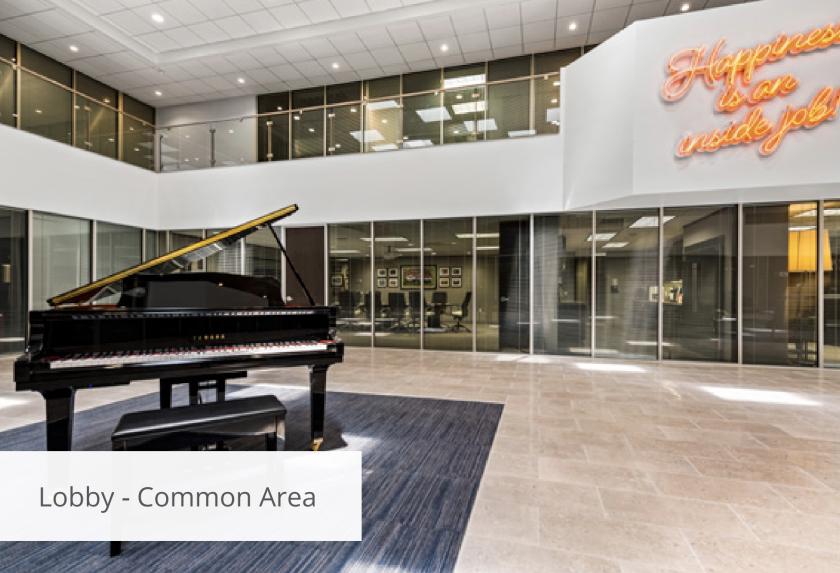
- • Updated common areas
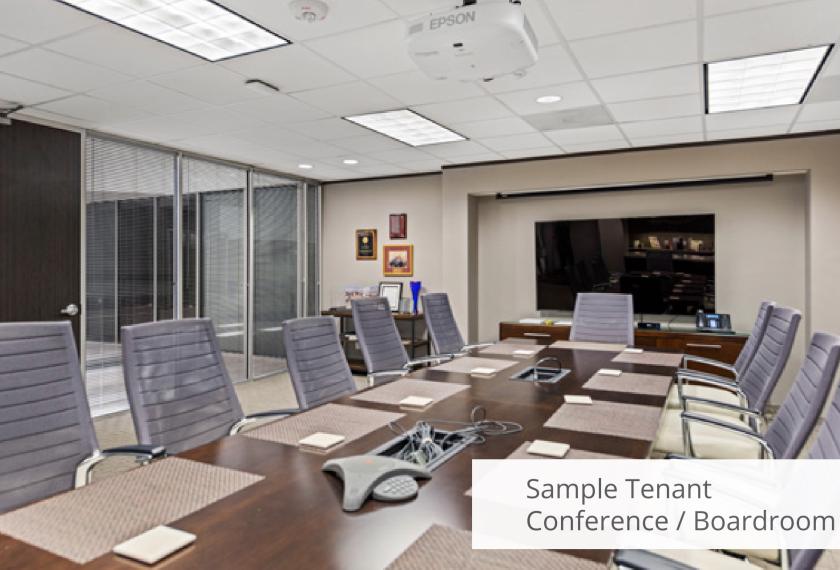
- • Newly constructed conference facility
- • Nearby mass transit
Additional Photos


Listing Agents

Douglas Pack
O: 713-835-0041
M: 713-818-5782
doug.pack@colliers.com
O: 713-835-0041
M: 713-818-5782
doug.pack@colliers.com

Sam Hansen
O: 713-835-0040
M: 281-684-1766
sam.hansen@colliers.com
O: 713-835-0040
M: 281-684-1766
sam.hansen@colliers.com
While we strive to provide the most accurate information, all listing information, and demographic data, is provided by third-parties. As such, MyEListing will not be responsible for the accuracy of the information. It is strongly recommended that you verify all information with the listing agent, and any relevant agencies, prior to making any decisions.