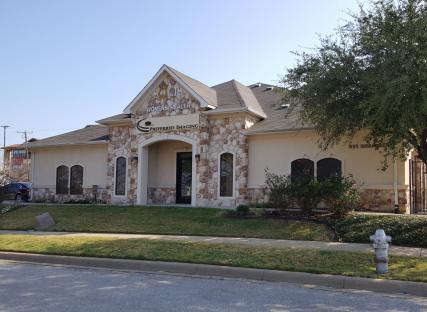
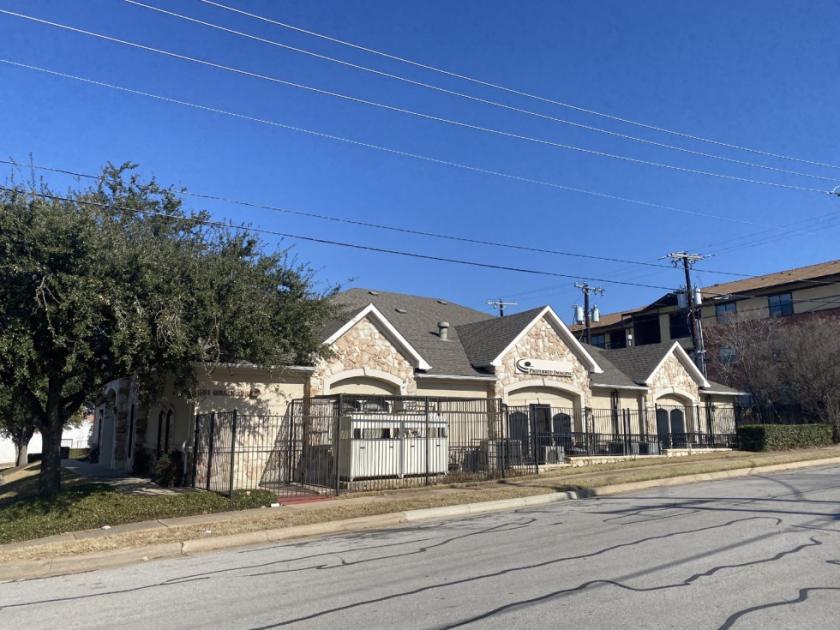
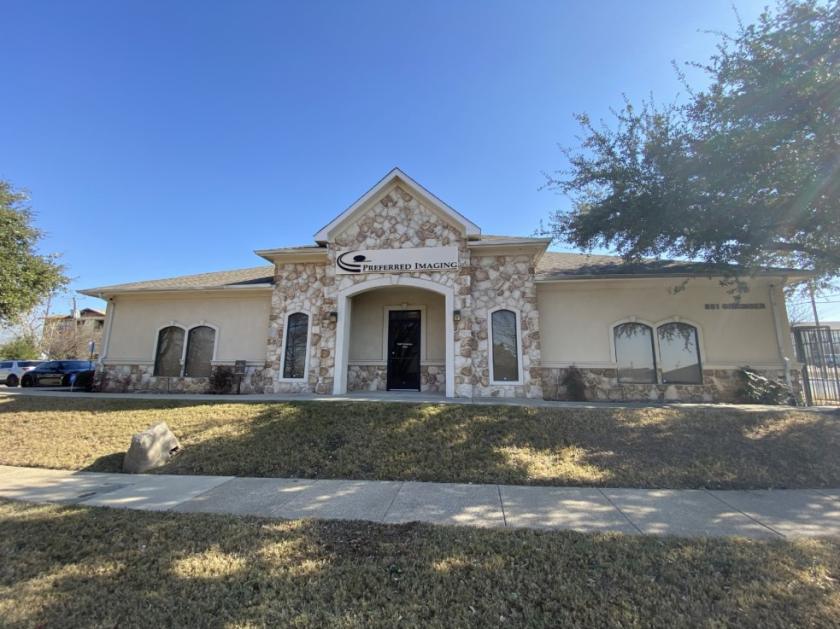
Office Space
851 Grainger Street Fort Worth, TX 76104
851 Grainger Street Fort Worth, TX 76104
Details & Description
Property Highlights
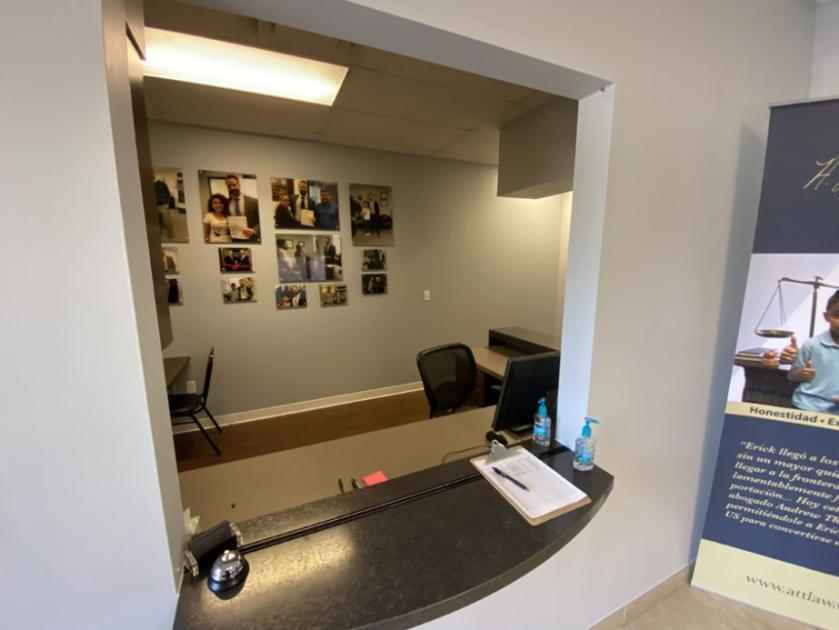
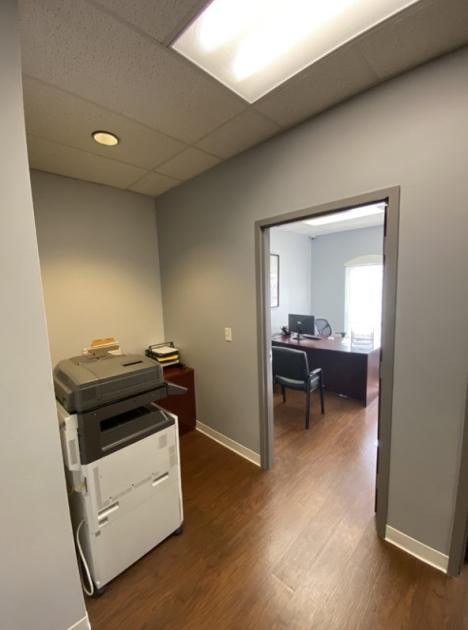
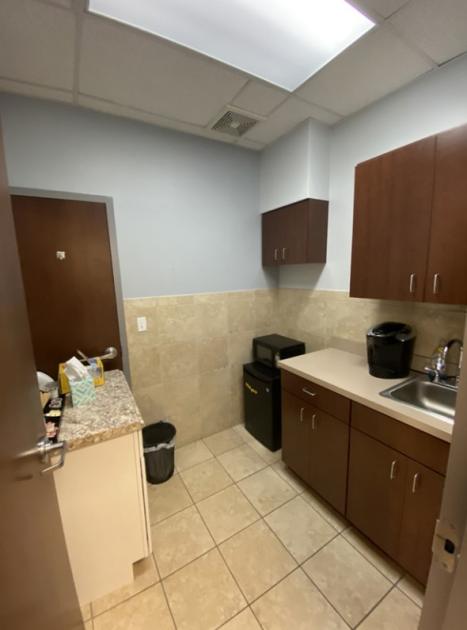
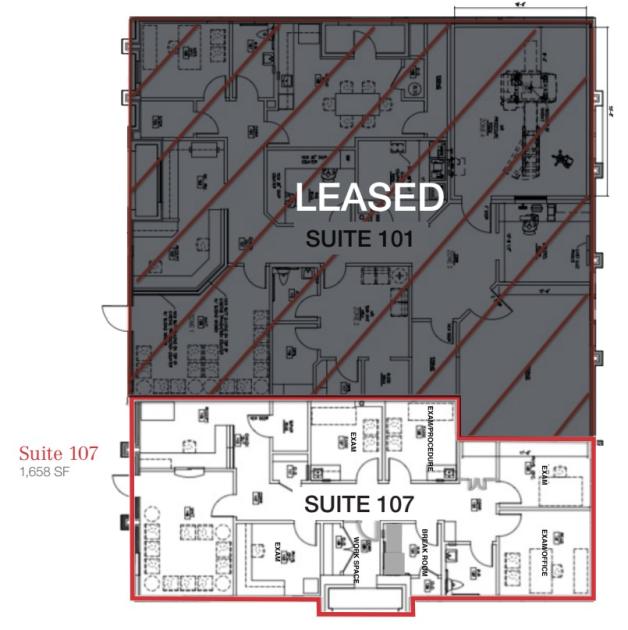
- • Move-In Ready Medical Offices
- • 4 Offices/Exam Rooms
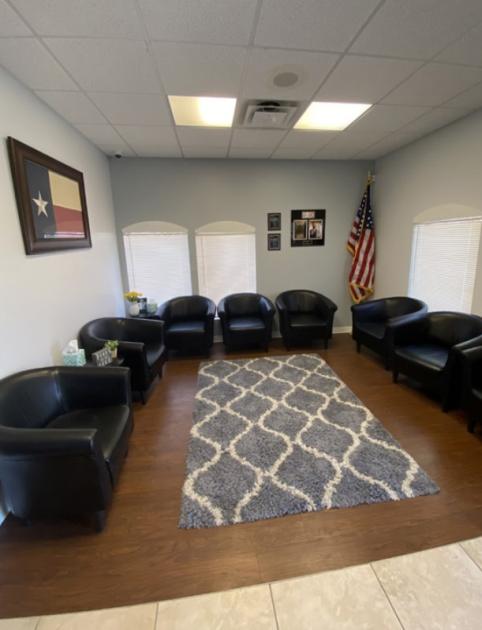
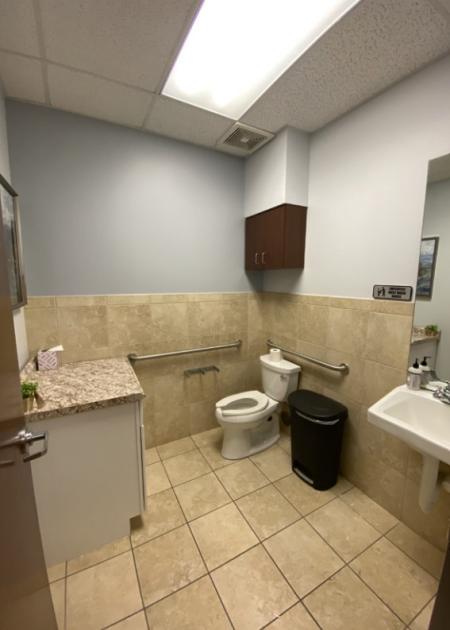
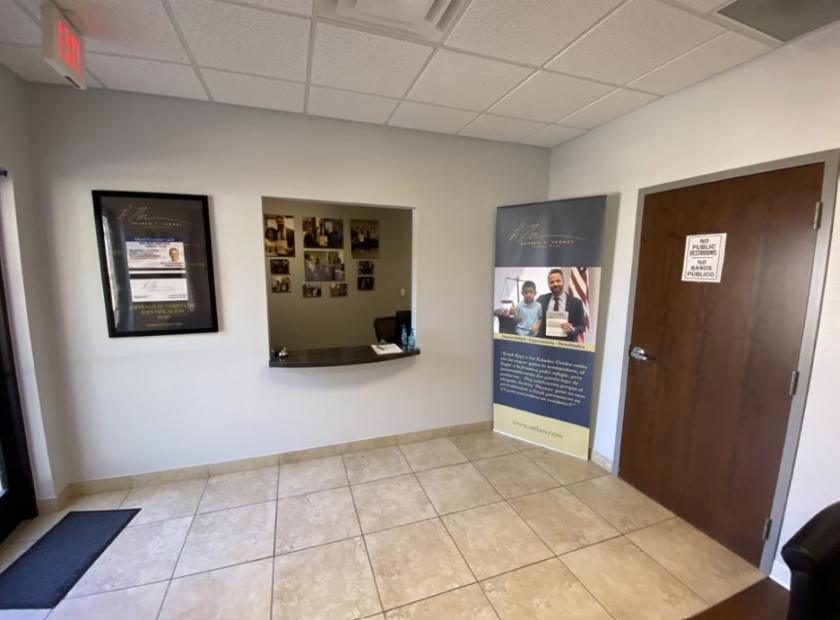
- • Break Area, Private Restroom, Reception Area
Additional Photos
Listing Agents

Logan May
O: 817-872-3909
M: 325-642-4312
lmay@nairl.com
O: 817-872-3909
M: 325-642-4312
lmay@nairl.com

Jayson Montoya
O: 214-256-7136
M: 214-926-7347
jmontoya@nairl.com
O: 214-256-7136
M: 214-926-7347
jmontoya@nairl.com
While we strive to provide the most accurate information, all listing information, and demographic data, is provided by third-parties. As such, MyEListing will not be responsible for the accuracy of the information. It is strongly recommended that you verify all information with the listing agent, and any relevant agencies, prior to making any decisions.