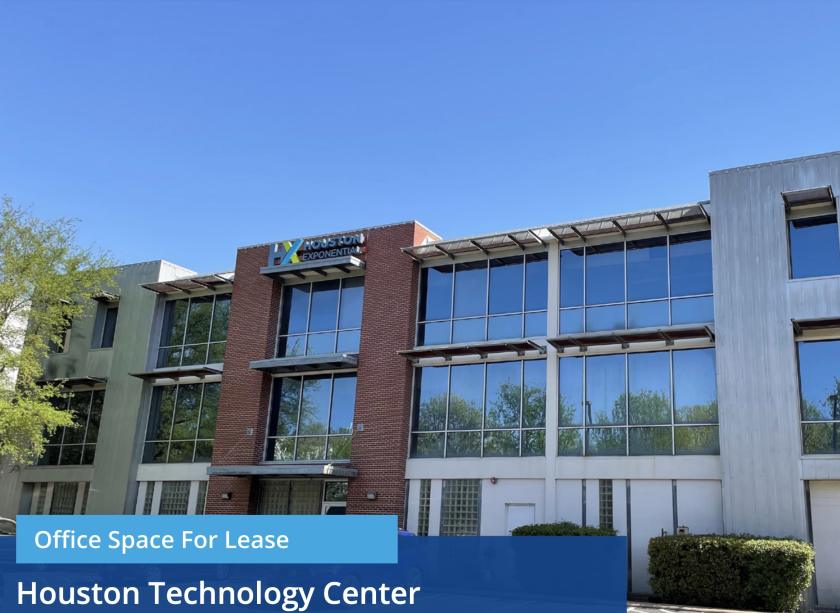
Office Space
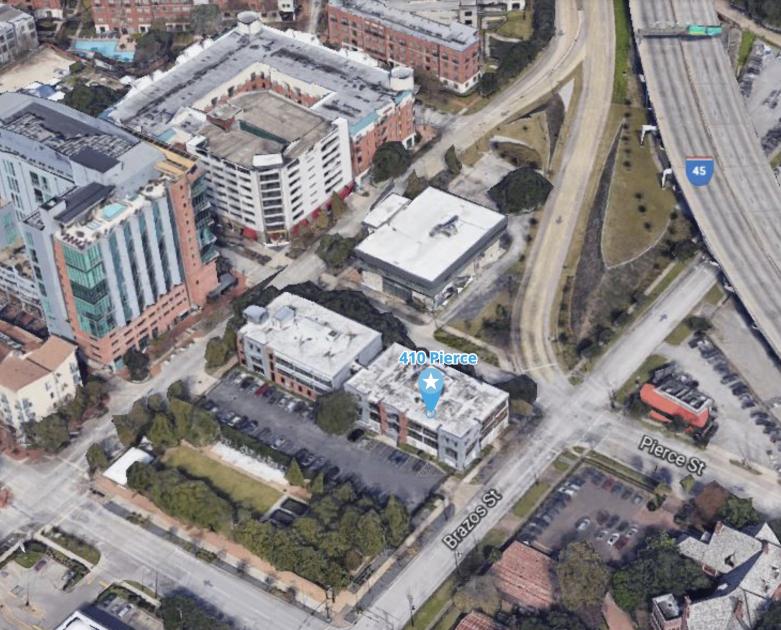
410 Pierce Street Houston, TX 77002
410 Pierce Street Houston, TX 77002
Details & Description
Property Highlights
- • Gated surface parking lot
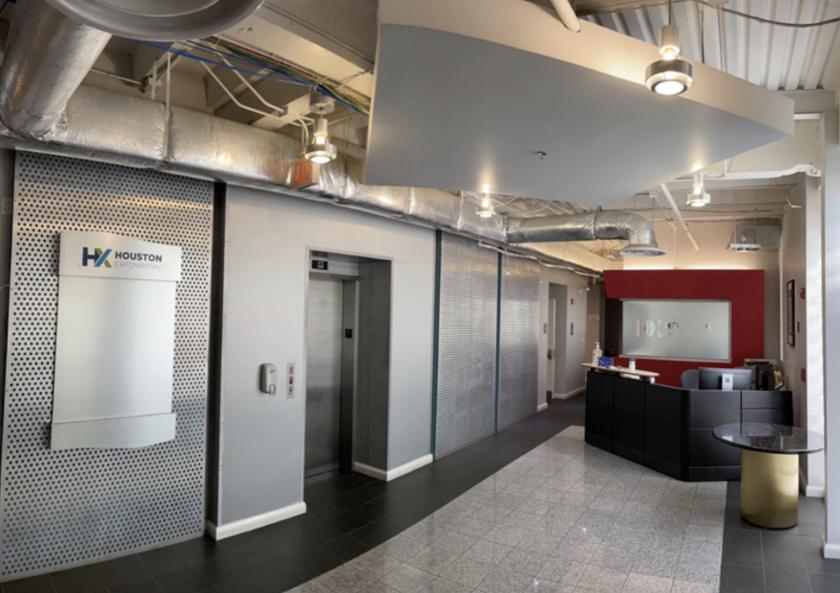
- • Controlled access
- • On-site management
- • Conference facility
- • 1.5/1,000 SF parking ratio
- • Reception
Listing Agents

Douglas Pack
O: 713-835-0041
M: 713-818-5782
doug.pack@colliers.com
O: 713-835-0041
M: 713-818-5782
doug.pack@colliers.com

Sam Hansen
O: 713-835-0040
M: 281-684-1766
sam.hansen@colliers.com
O: 713-835-0040
M: 281-684-1766
sam.hansen@colliers.com

Preston Smith
Colliers
O: 713-835-0071
M: 832-459-5098
preston.smith@colliers.com
Colliers
O: 713-835-0071
M: 832-459-5098
preston.smith@colliers.com
While we strive to provide the most accurate information, all listing information, and demographic data, is provided by third-parties. As such, MyEListing will not be responsible for the accuracy of the information. It is strongly recommended that you verify all information with the listing agent, and any relevant agencies, prior to making any decisions.