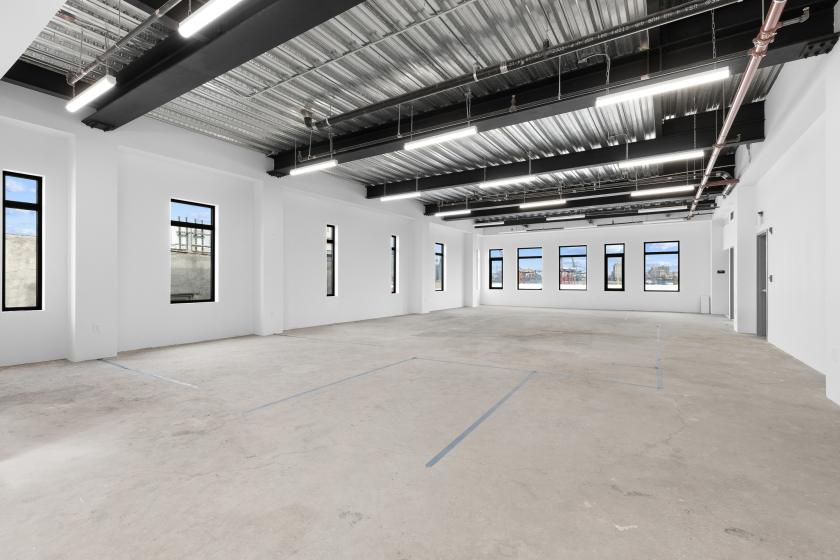
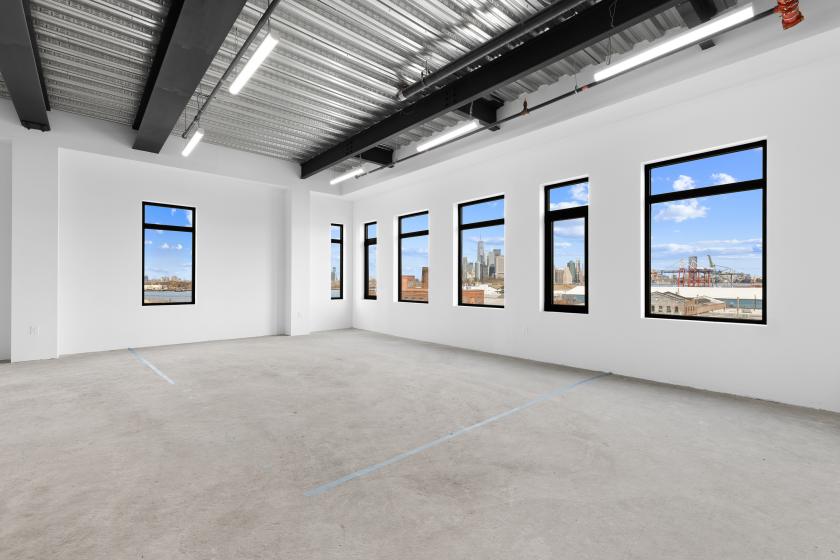
Office Space
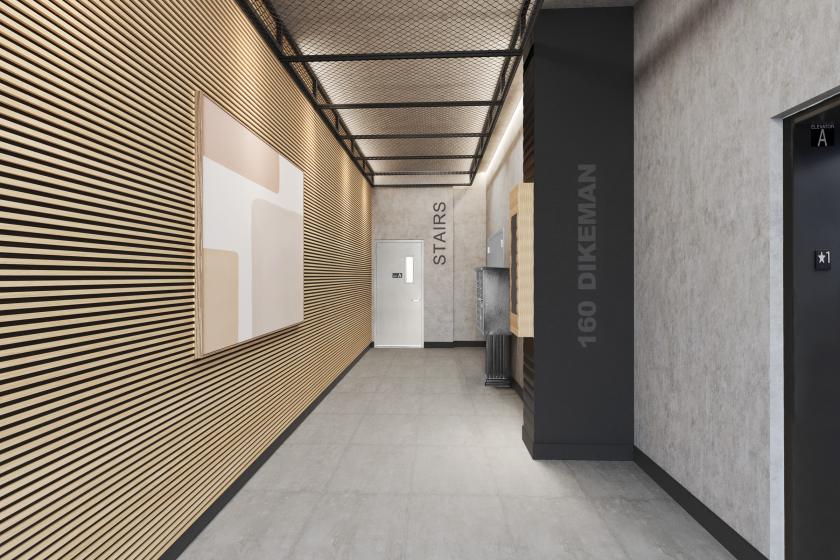
160 Dikeman Street Brooklyn, NY 11231
160 Dikeman Street Brooklyn, NY 11231
Details & Description
Property Highlights
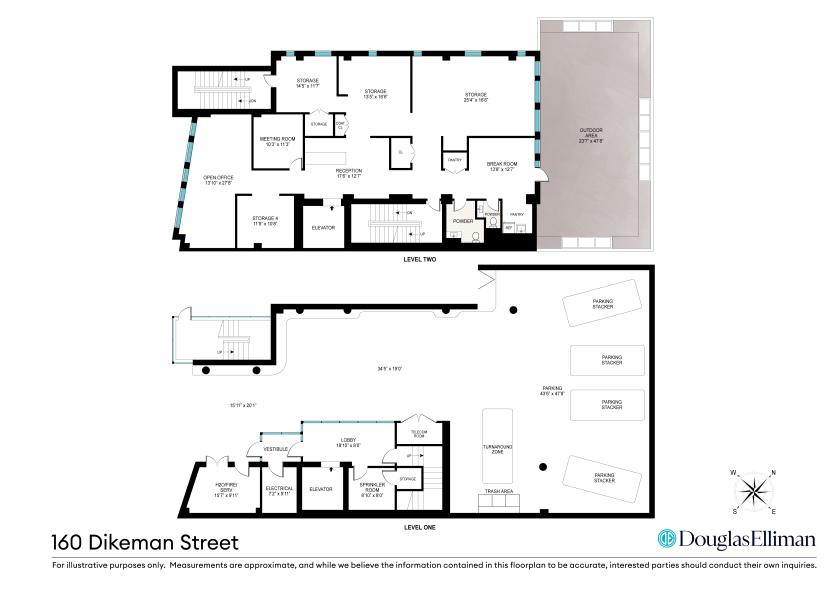
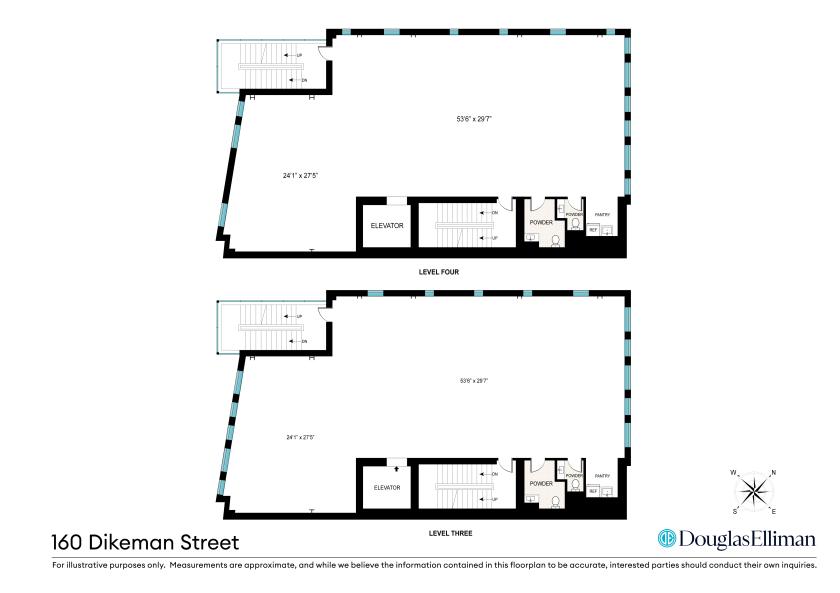
- • Building can be delivered vacant
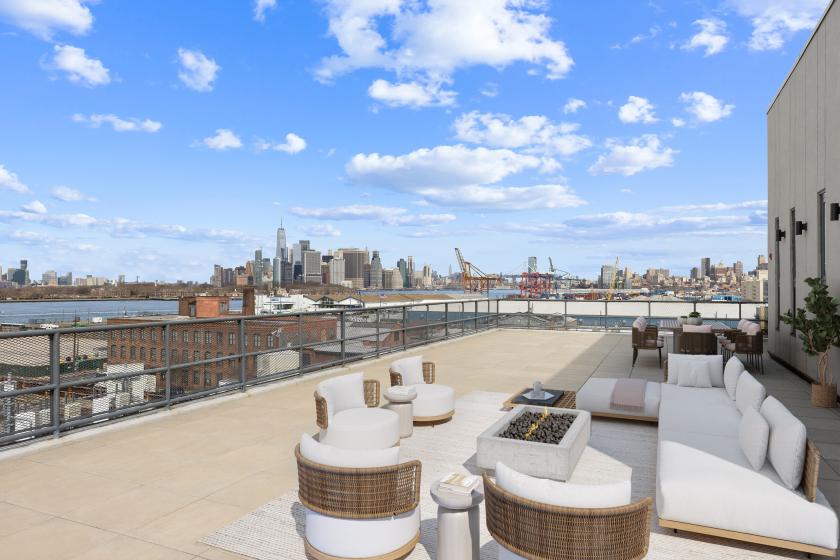
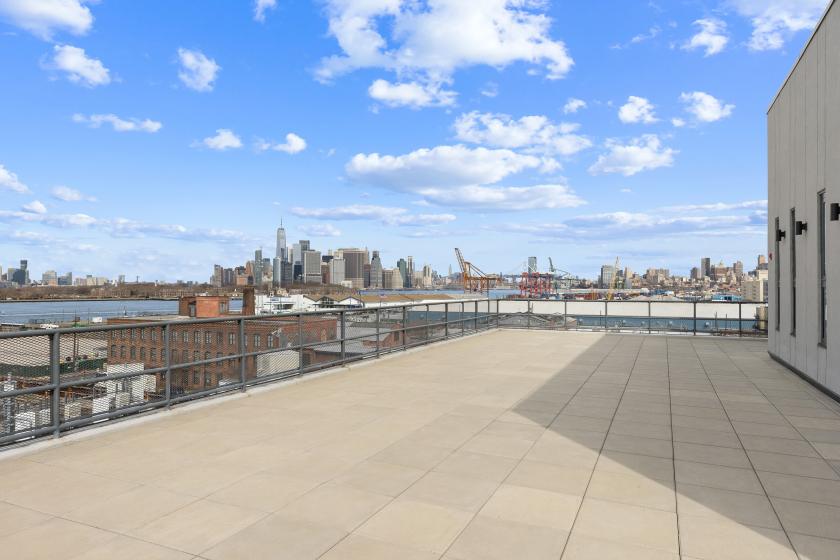
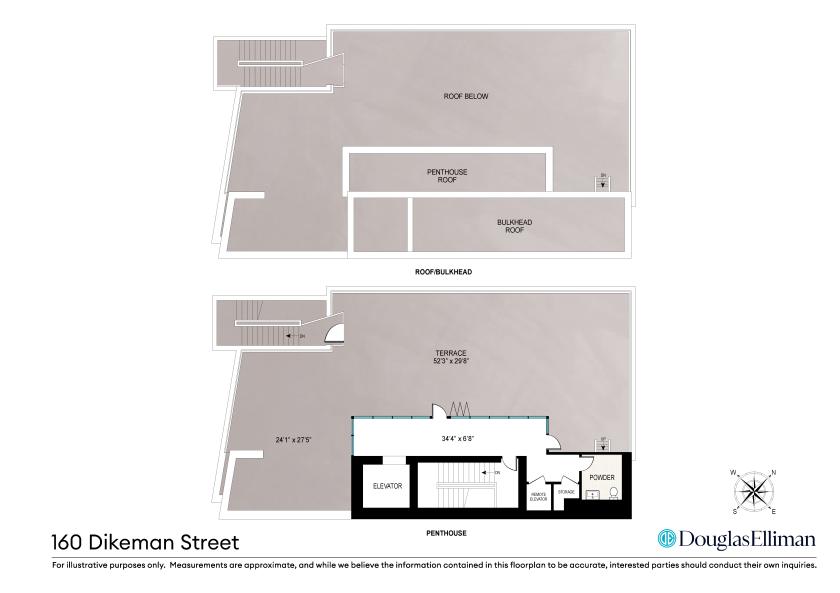
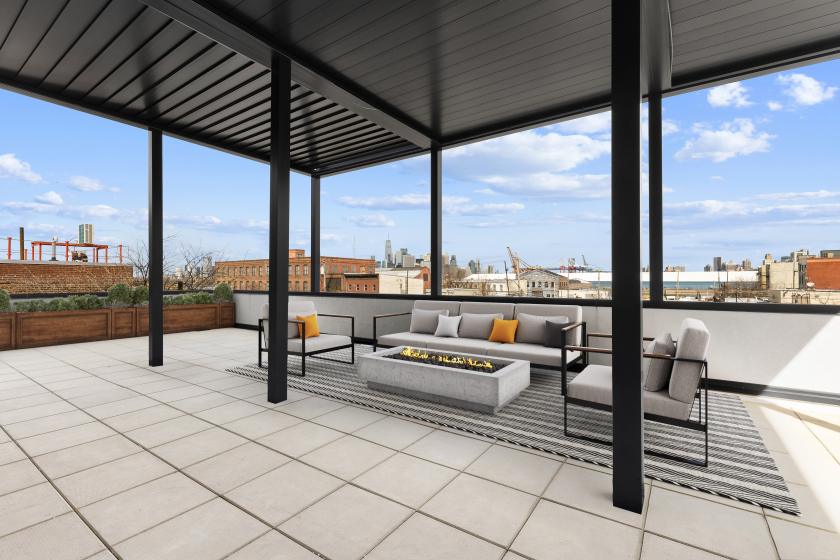
- • 5 including penthouse with roof deck
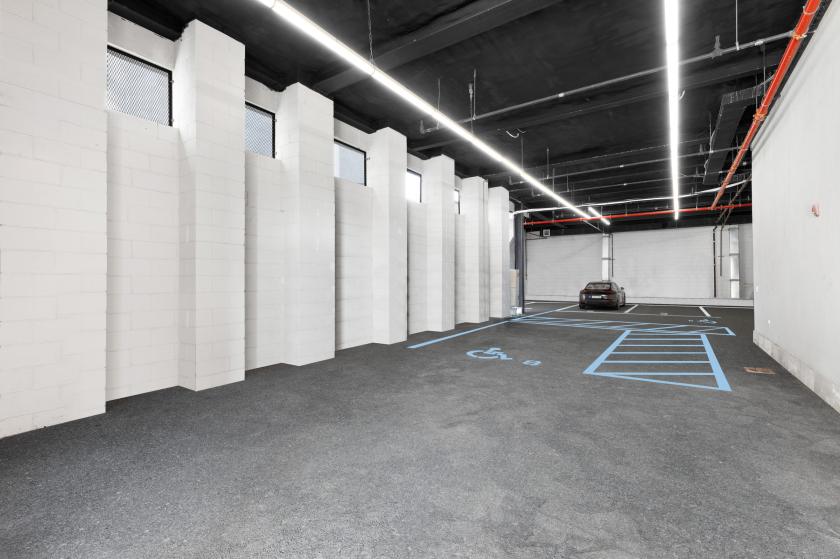
- • On site parking
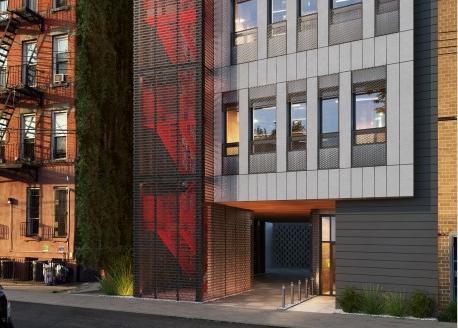
Additional Photos

Listing Agents

RJ Lennon
O: 917-202-8996
M: 917-202-8996
rjlennon@elliman.com
O: 917-202-8996
M: 917-202-8996
rjlennon@elliman.com
While we strive to provide the most accurate information, all listing information, and demographic data, is provided by third-parties. As such, MyEListing will not be responsible for the accuracy of the information. It is strongly recommended that you verify all information with the listing agent, and any relevant agencies, prior to making any decisions.