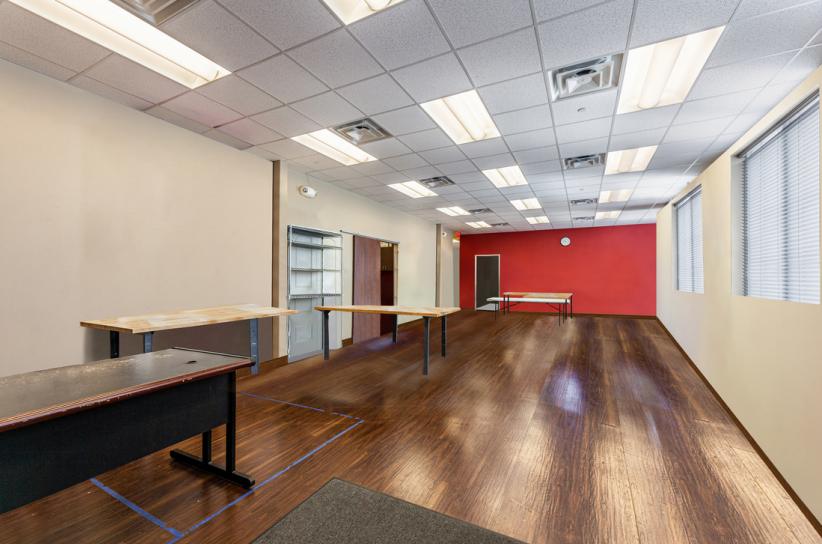
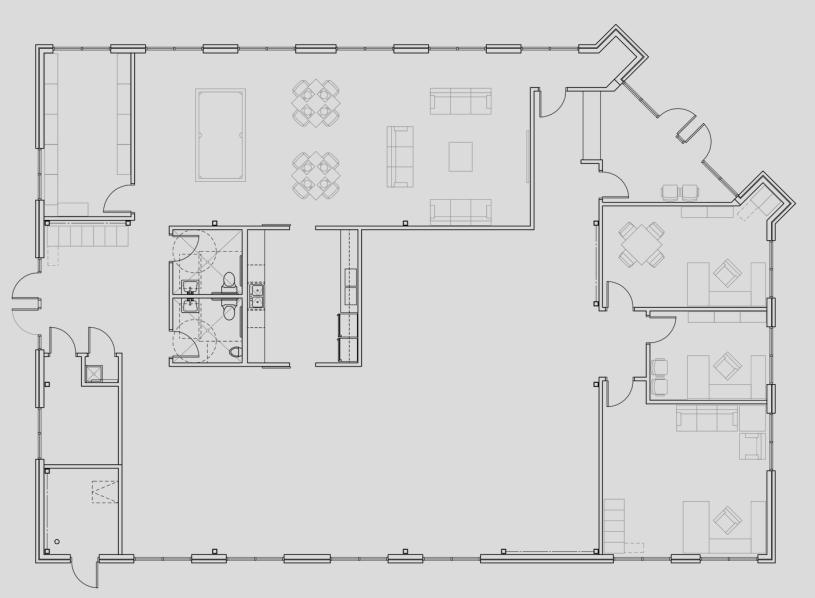
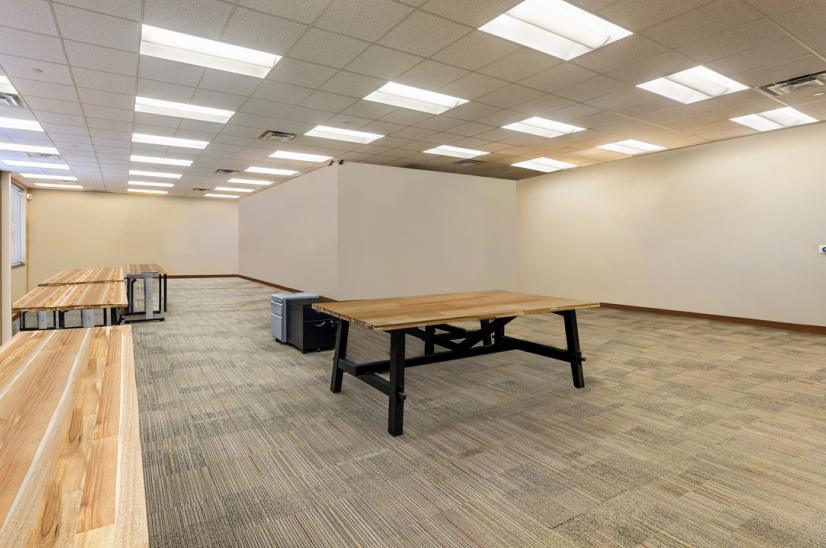
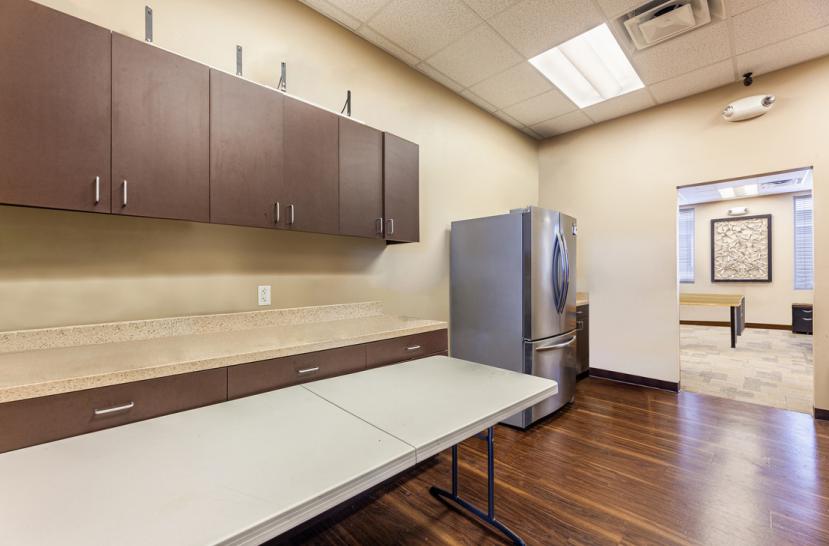
Office Space
3205 Talon Drive Richardson, TX 75082
3205 Talon Drive Richardson, TX 75082
Details & Description
Property Highlights
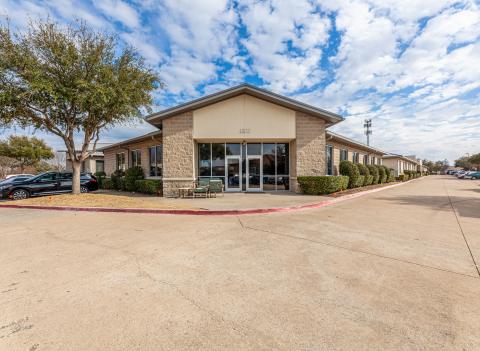
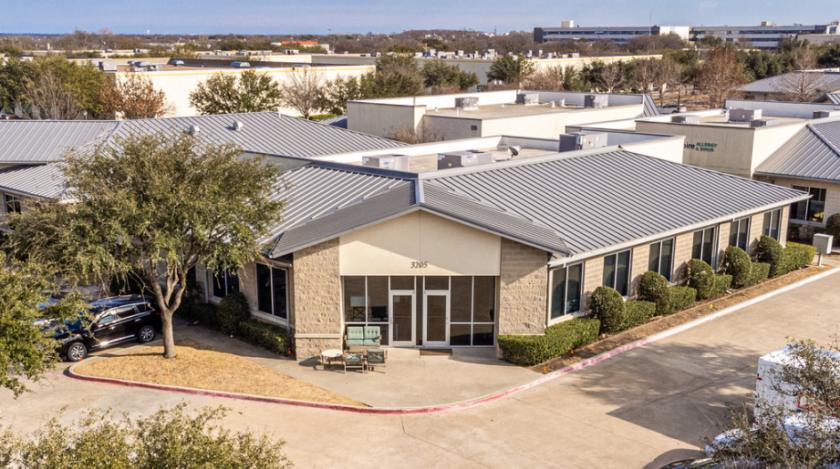
- • Freestanding Single Tenant Building
- • Great Accessibility
- • Abundant Parking 5:1000
Additional Photos

Listing Agents

Grant Frerichs
O: 214-256-7146
M: 214-601-0722
gfrerichs@nairl.com
O: 214-256-7146
M: 214-601-0722
gfrerichs@nairl.com
While we strive to provide the most accurate information, all listing information, and demographic data, is provided by third-parties. As such, MyEListing will not be responsible for the accuracy of the information. It is strongly recommended that you verify all information with the listing agent, and any relevant agencies, prior to making any decisions.