Office Space
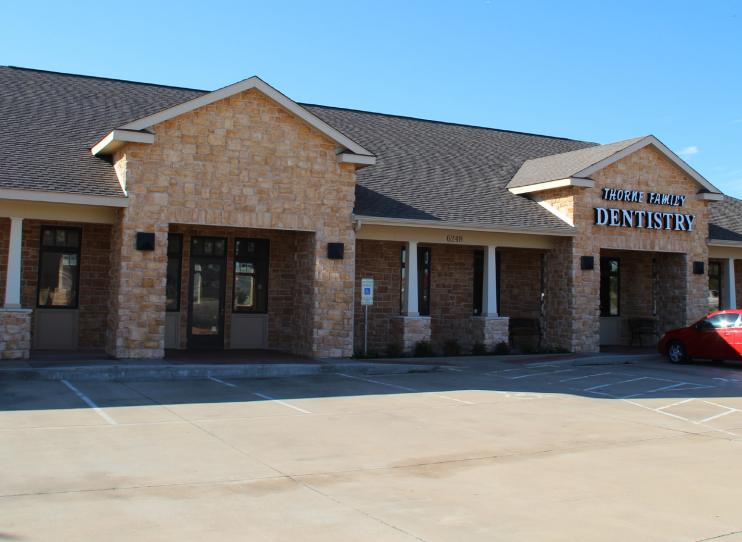
6252 Davis Boulevard North Richland Hills, TX 76180
6252 Davis Boulevard North Richland Hills, TX 76180
Details & Description
Property Highlights
- • Suite 100
- • 2,600 sf 2nd Generation Dental Office
- • Excellent Frontage to David Boulevard
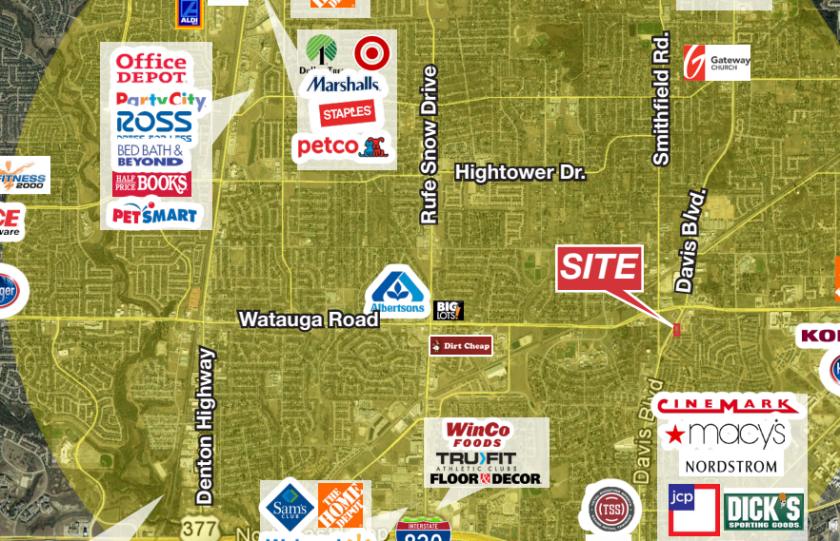
- • Easy Access to TX 26, TX 183, I-820
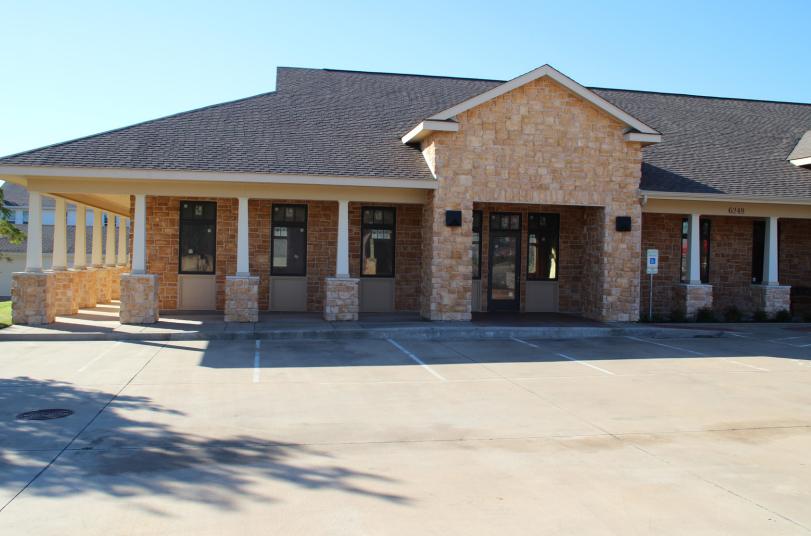
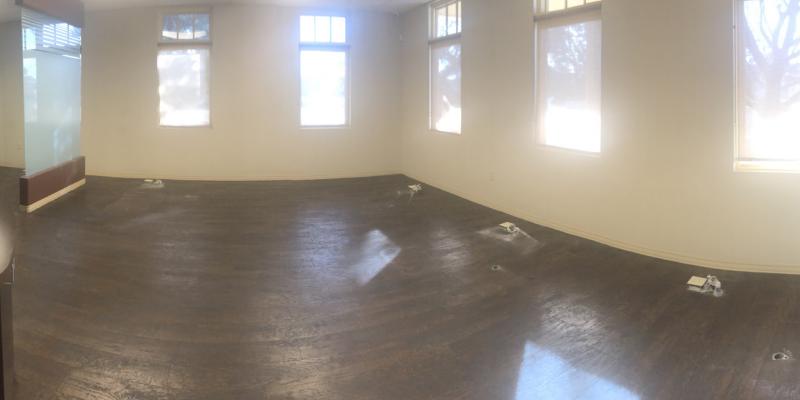
Additional Photos
Listing Agents

Luke Kelley
O: 214-256-7168
M: 214-588-0147
lkelley@nairl.com
O: 214-256-7168
M: 214-588-0147
lkelley@nairl.com

Jordan Johnson
O: 817-872-3912
M: 817-437-2761
jjohnson@nairl.com
O: 817-872-3912
M: 817-437-2761
jjohnson@nairl.com
While we strive to provide the most accurate information, all listing information, and demographic data, is provided by third-parties. As such, MyEListing will not be responsible for the accuracy of the information. It is strongly recommended that you verify all information with the listing agent, and any relevant agencies, prior to making any decisions.


