Retail Space
2811 Bledsoe Street Fort Worth, TX 76107
2811 Bledsoe Street Fort Worth, TX 76107
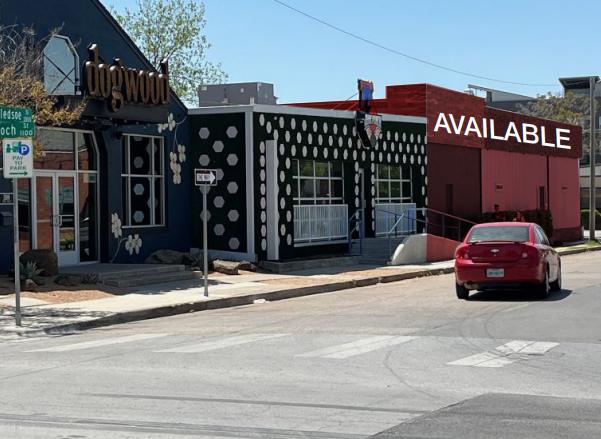
Details & Description
Property Highlights
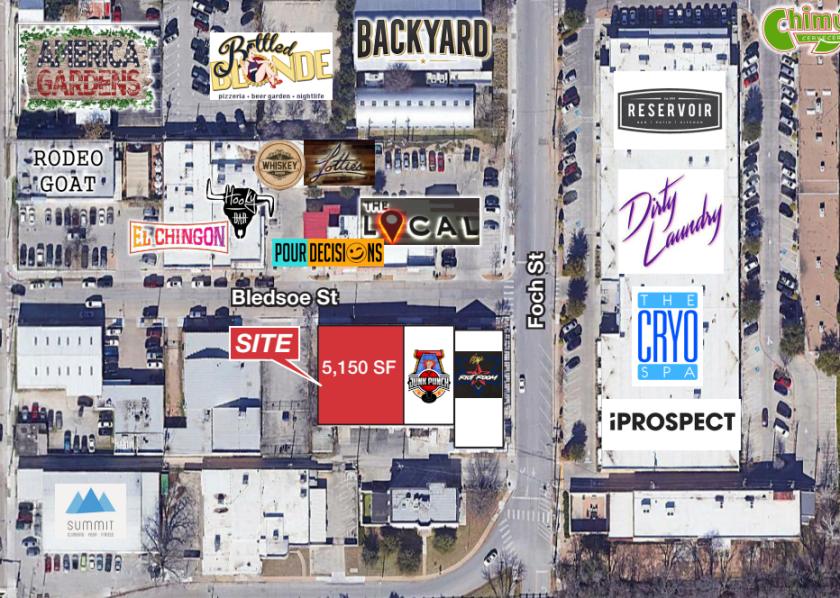
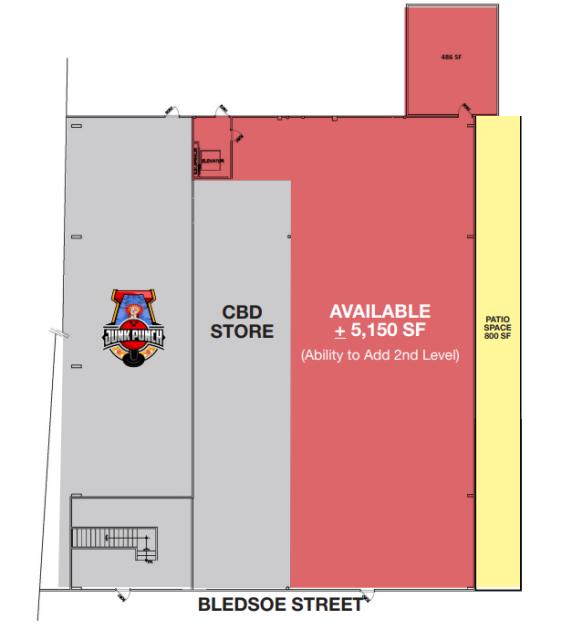
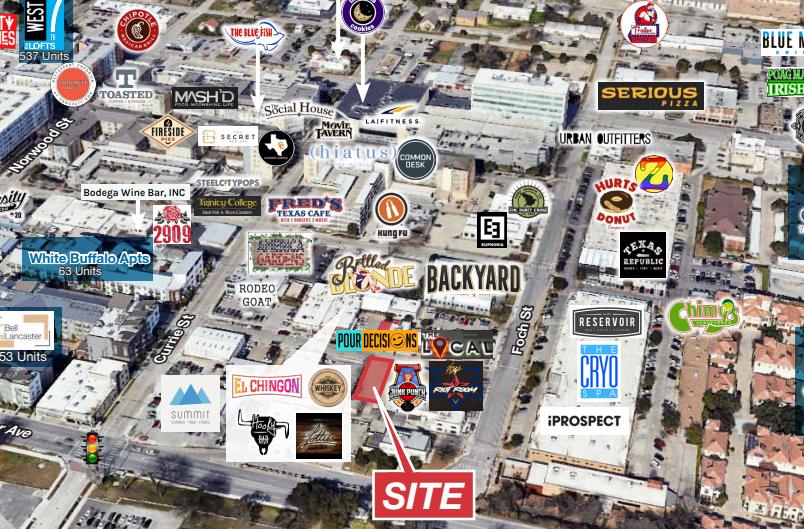
- • 5,150 SF Bar/Restaurant Space Available
- • 800 SF Patio Fronting Bledsoe Street
- • Opportunity for a Rooftop Deck
- • Zoning: MU-2
Additional Photos
Listing Agents

Jordan Johnson
O: 817-872-3912
M: 817-437-2761
jjohnson@nairl.com
O: 817-872-3912
M: 817-437-2761
jjohnson@nairl.com
Jake Blankenship
O: 817-872-3904
M: 512-415-4299
jblankenship@nairl.com
O: 817-872-3904
M: 512-415-4299
jblankenship@nairl.com
While we strive to provide the most accurate information, all listing information, and demographic data, is provided by third-parties. As such, MyEListing will not be responsible for the accuracy of the information. It is strongly recommended that you verify all information with the listing agent, and any relevant agencies, prior to making any decisions.