Office Space
2570 River Park Drive Fort Worth, TX 76116
2570 River Park Drive Fort Worth, TX 76116

Details & Description
Property Highlights
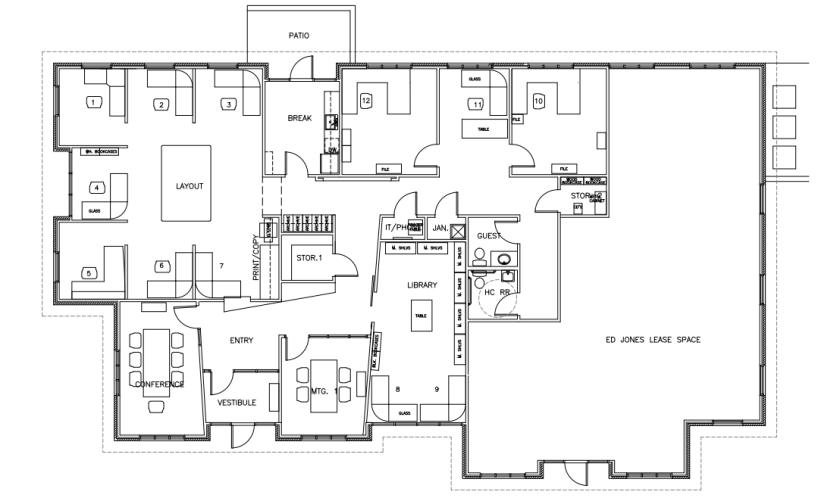
- • Beautiful Move-In Ready Garden Office
- • Perfect for General Office or Medical Office
- • Designated Parking in Front of Suite
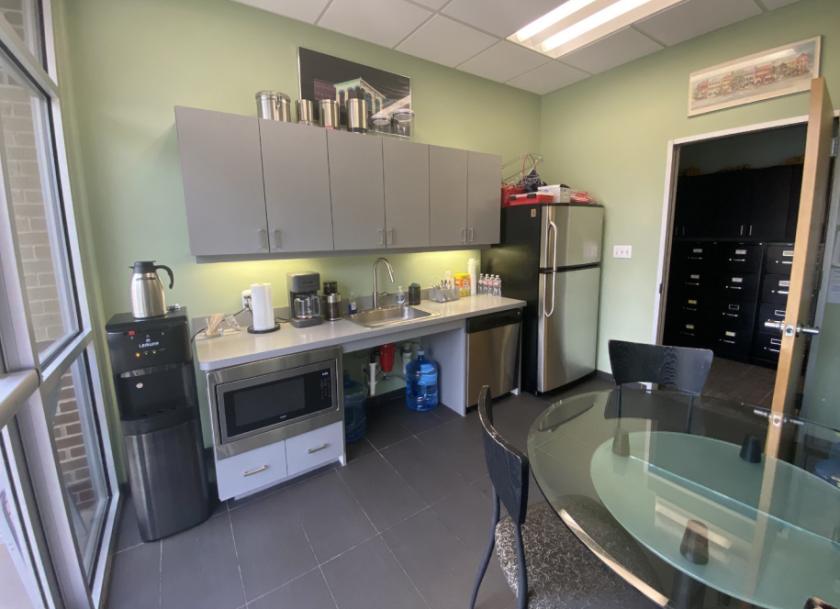
- • Includes Break Room/Kitchenette
Additional Photos


Listing Agents

Logan May
O: 817-872-3909
M: 325-642-4312
lmay@nairl.com
O: 817-872-3909
M: 325-642-4312
lmay@nairl.com

Jordan Johnson
O: 817-872-3912
M: 817-437-2761
jjohnson@nairl.com
O: 817-872-3912
M: 817-437-2761
jjohnson@nairl.com
While we strive to provide the most accurate information, all listing information, and demographic data, is provided by third-parties. As such, MyEListing will not be responsible for the accuracy of the information. It is strongly recommended that you verify all information with the listing agent, and any relevant agencies, prior to making any decisions.