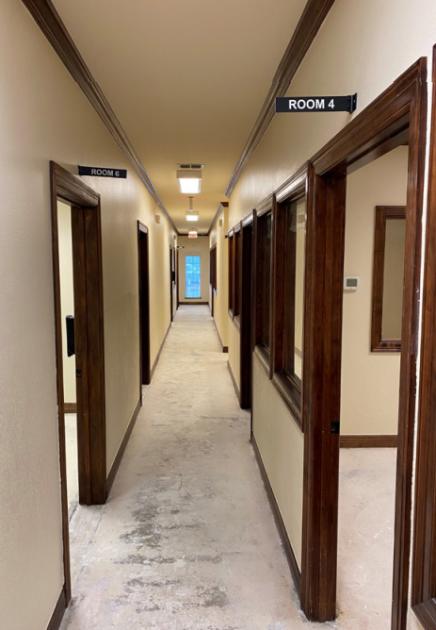
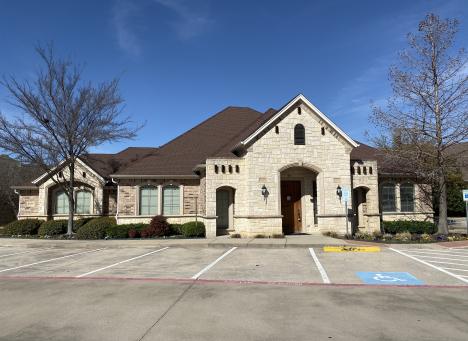
Office Space
8313 Whitley Road Watauga, TX 76148
8313 Whitley Road Watauga, TX 76148
Details & Description
Property Highlights
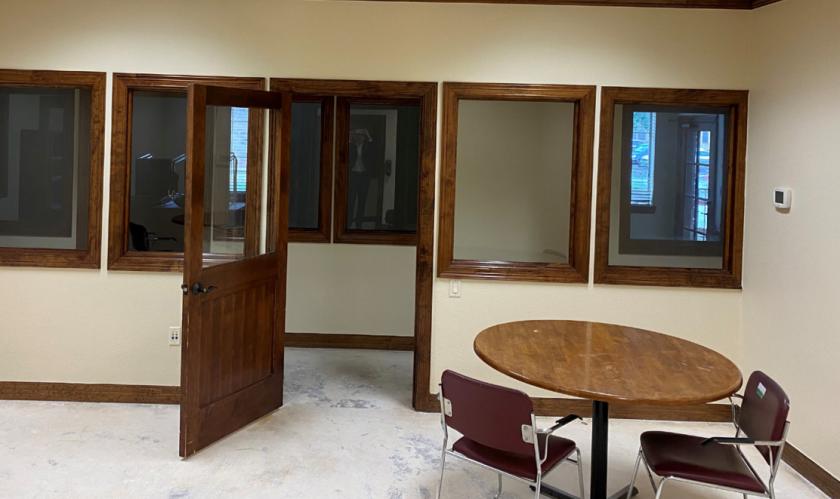
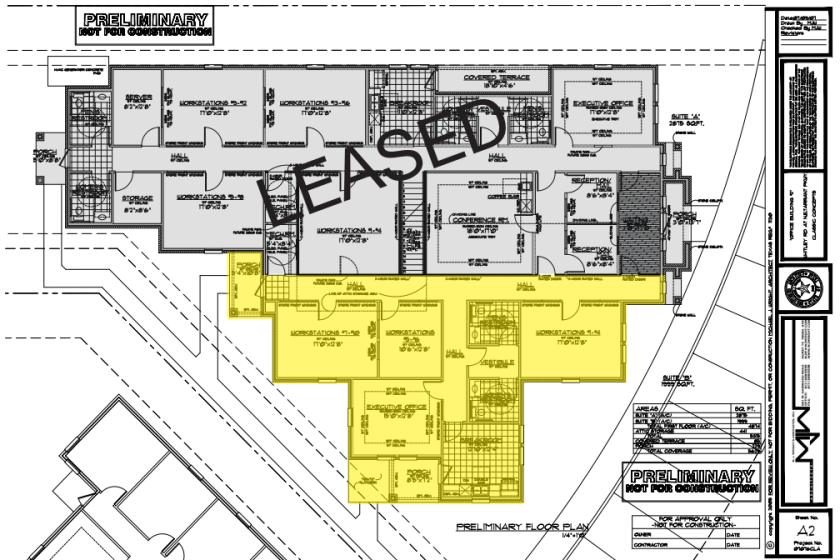
- • 2nd Gen Medica
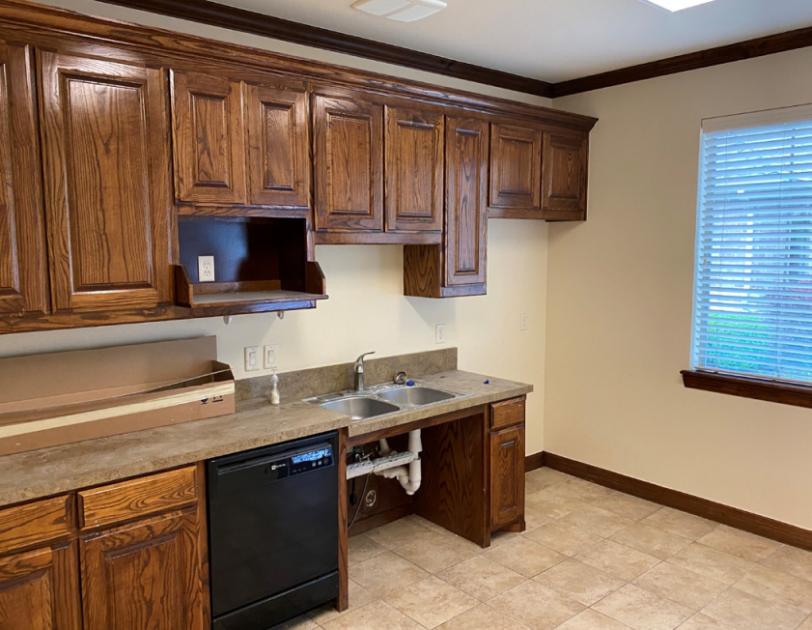
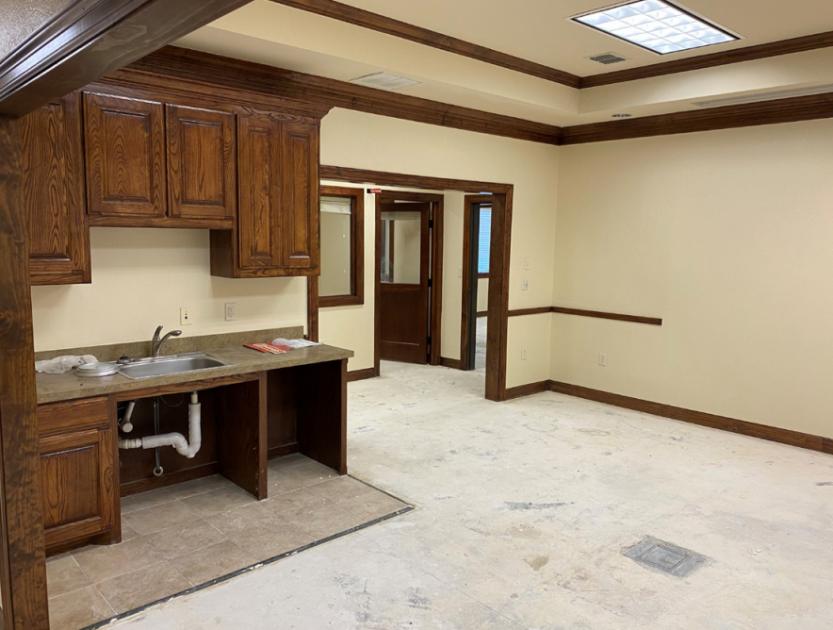
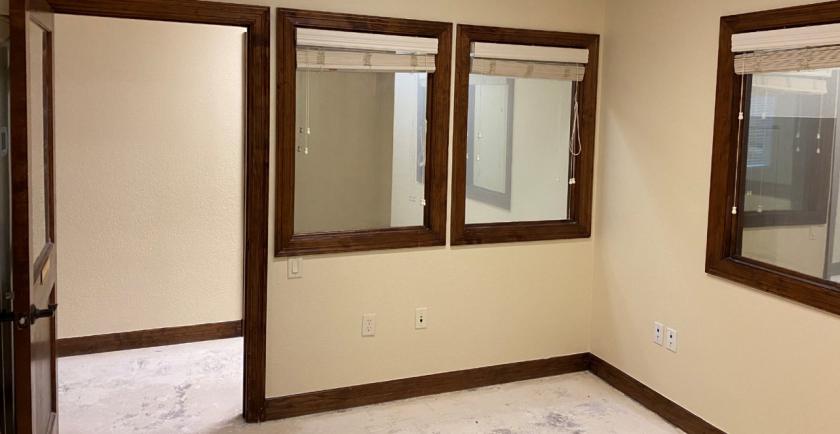
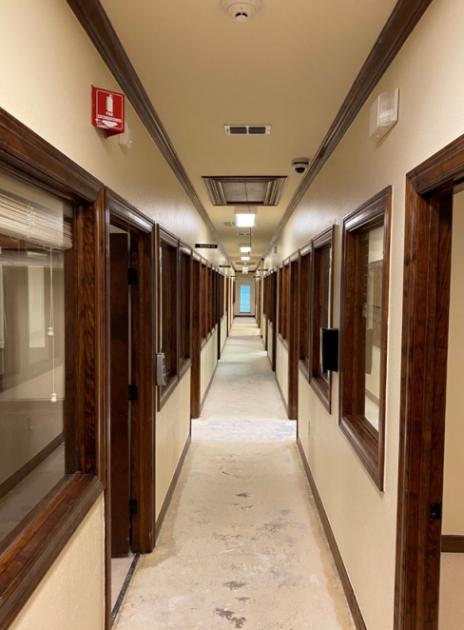
- • Great Interior Finish Out
- • Building Equipped with Back Up Generator
- • Extensive Security System Installed
- • Suite With Private Entrance & Kitchen
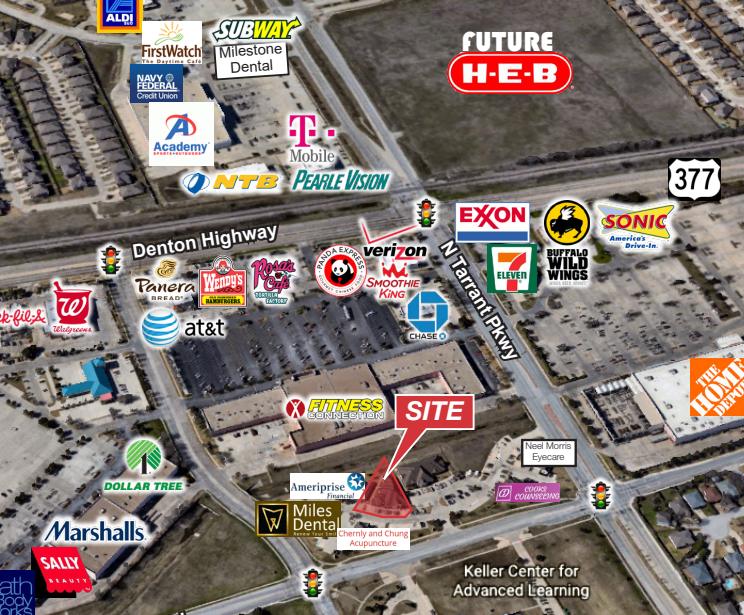
- • Parking Ratio: 5/1,000
Additional Photos
Listing Agents

Logan May
O: 817-872-3909
M: 325-642-4312
lmay@nairl.com
O: 817-872-3909
M: 325-642-4312
lmay@nairl.com

Jon McDaniel
O: 817-872-3902
M: 817-291-4451
jmcdaniel@nairl.com
O: 817-872-3902
M: 817-291-4451
jmcdaniel@nairl.com
While we strive to provide the most accurate information, all listing information, and demographic data, is provided by third-parties. As such, MyEListing will not be responsible for the accuracy of the information. It is strongly recommended that you verify all information with the listing agent, and any relevant agencies, prior to making any decisions.