Retail Space
5714 Kennett Pike Wilmington, DE 19807
5714 Kennett Pike Wilmington, DE 19807

Details & Description
Property Highlights
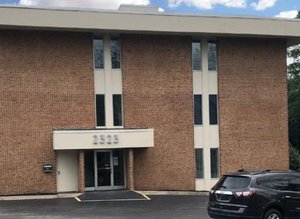
- • Historic property
- • Mix of office and retail spaces
- • Ingress and egress on Kennett Pike
- • On-site parking
Listing Agents

Bart Mackey
O: 302-622-3515
mackey@pattersonwoods.com
O: 302-622-3515
mackey@pattersonwoods.com
While we strive to provide the most accurate information, all listing information, and demographic data, is provided by third-parties. As such, MyEListing will not be responsible for the accuracy of the information. It is strongly recommended that you verify all information with the listing agent, and any relevant agencies, prior to making any decisions.