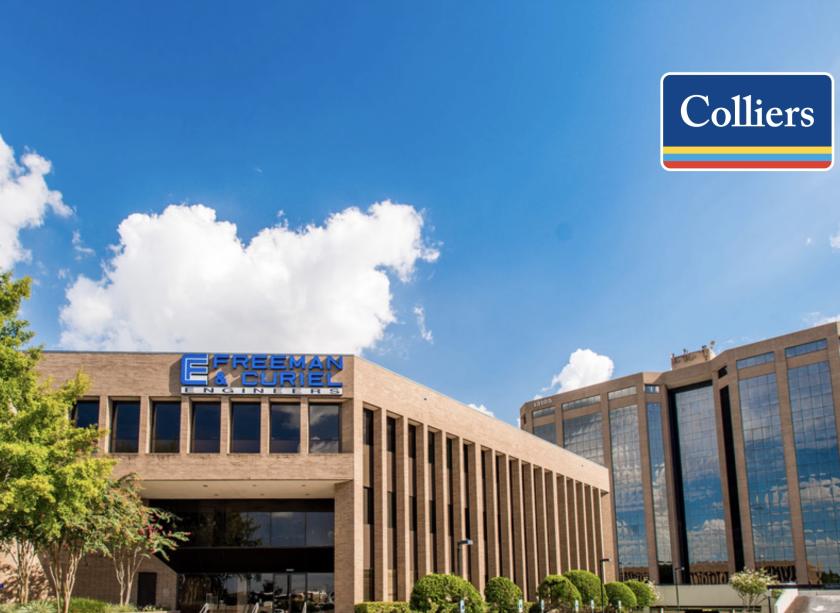
Office Space
13101 Northwest Freeway Houston, TX 77040
13101 Northwest Freeway Houston, TX 77040
Details & Description
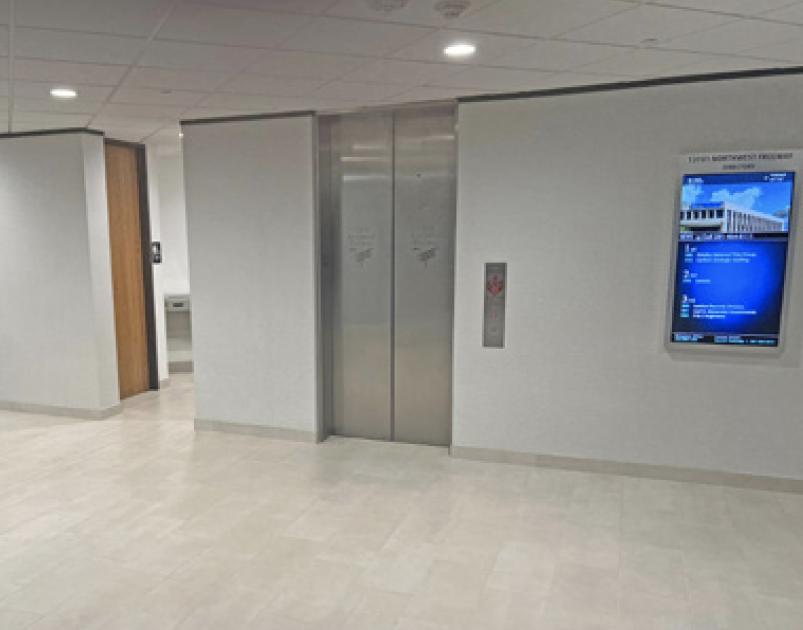
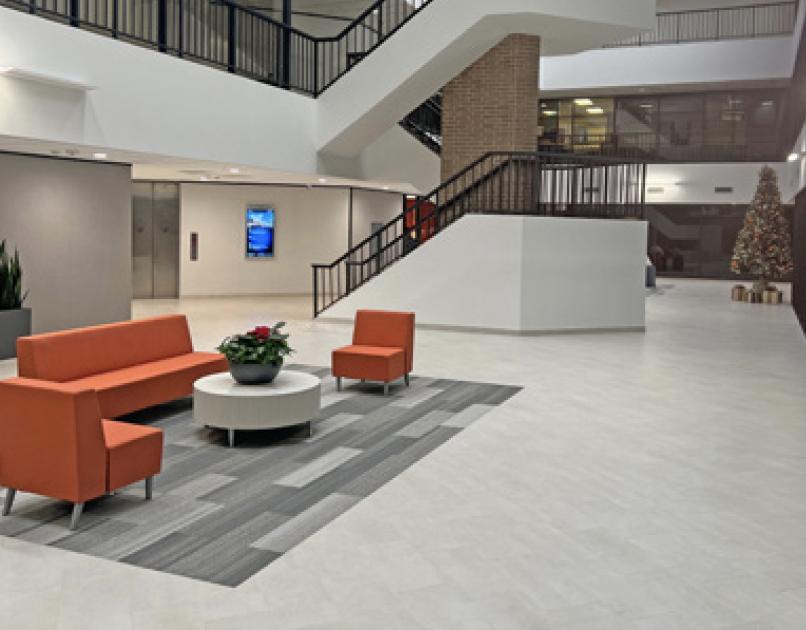
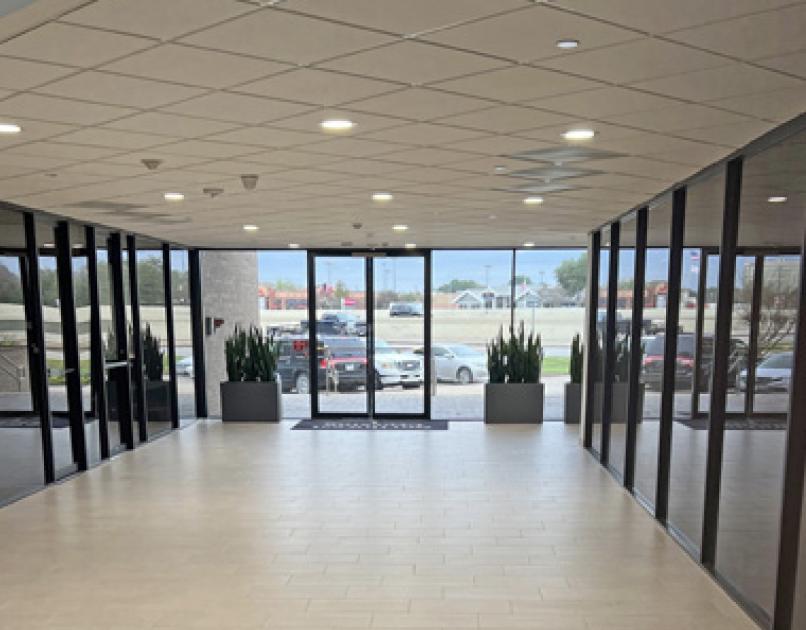
Property Highlights
- • Conference and Training Facilities
- • Flexible space layouts
- • Competitive, full-service rates
- • Landscaped interior atrium
- • Surveillance system
- • After-hours card access
Additional Photos
Listing Agents

Douglas Pack
O: 713-835-0041
M: 713-818-5782
doug.pack@colliers.com
O: 713-835-0041
M: 713-818-5782
doug.pack@colliers.com

Sam Hansen
O: 713-835-0040
M: 281-684-1766
sam.hansen@colliers.com
O: 713-835-0040
M: 281-684-1766
sam.hansen@colliers.com
While we strive to provide the most accurate information, all listing information, and demographic data, is provided by third-parties. As such, MyEListing will not be responsible for the accuracy of the information. It is strongly recommended that you verify all information with the listing agent, and any relevant agencies, prior to making any decisions.


