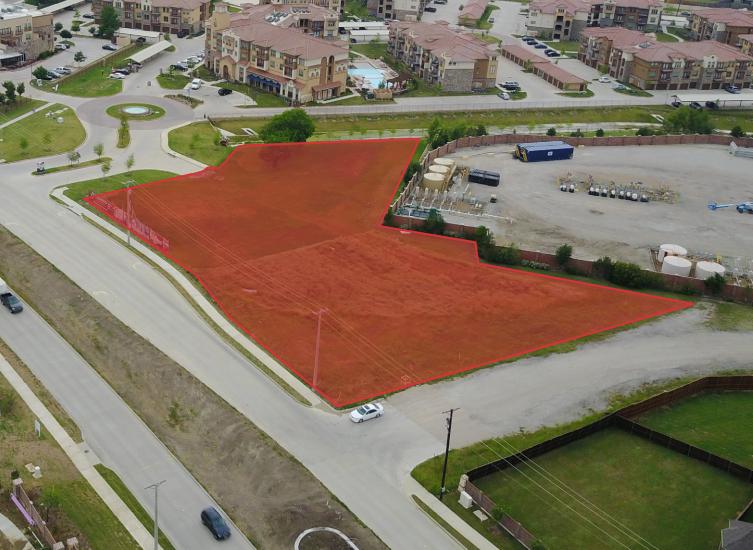
1-Mile | 3-Miles | 5-Miles | ||
---|---|---|---|---|
Total Population | 21,063 | 107,670 | 227,840 | |
Population Median Age | 34 | 34 | 35 | |
Population by Age | 0-9 Yrs | 2701 (12%) | 14498 (13%) | 30711 (13%) |
10-19 Yrs | 3789 (17%) | 19332 (17%) | 40922 (17%) | |
20-29 Yrs | 2967 (14%) | 14649 (13%) | 29430 (12%) | |
30-39 Yrs | 2952 (14%) | 14041 (13%) | 30039 (13%) | |
40-49 Yrs | 3194 (15%) | 15759 (14%) | 33486 (14%) | |
50-59 Yrs | 3111 (14%) | 14978 (13%) | 31404 (13%) | |
60-69 Yrs | 1400 (6%) | 8892 (8%) | 19926 (8%) | |
70+ Yrs | 949 (4%) | 5523 (5%) | 11922 (5%) | |
Median HH Income | $98,697 | $92,535 | $92,576 | |
Total Household Income | < 24K | 341 (5%) | 2233 (7%) | 5254 (7%) |
25-49K | 618 (10%) | 4230 (13%) | 9112 (13%) | |
50-74K | 1115 (18%) | 5642 (18%) | 12044 (17%) | |
75-99K | 1071 (17%) | 4988 (15%) | 11068 (16%) | |
100-199K | 2694 (43%) | 11054 (35%) | 24415 (35%) | |
200K+ | 340 (5%) | 3062 (9%) | 6491 (9%) | |
Highest Education Level | No Diploma | 891 | 6305 | 13457 |
Diploma or GED | 2551 | 14375 | 29298 | |
Some College | 3304 | 15183 | 33464 | |
Assoc. Degree | 1632 | 6821 | 13596 | |
Bachelors Degree | 3337 | 14711 | 32498 | |
Higher Degree | 1413 | 8436 | 17969 | |
Total Housing Units | 6,525 | 31,993 | 70,747 | |
--Owner-Occupied | 5,191 | 24,660 | 53,233 | |
--Renter-Occupied | 988 | 6,549 | 15,153 | |
Owner-Occupied Values | < 100K | 105 | 1020 | 2616 |
100-199K | 1562 | 8556 | 18279 | |
200-299K | 2617 | 9609 | 18296 | |
300-399K | 776 | 3880 | 9828 | |
400-499K | 108 | 1128 | 2850 | |
500K+ | 23 | 467 | 1364 | |
Total Working Age Population | 16,085 | 81,541 | 172,693 | |
In Work Force | 11,708 | 58,259 | 122,820 | |
Not In Work Force | 4,378 | 23,282 | 49,873 | |
Workforce Employed | 11,096 | 55,028 | 116,951 | |
Workforce Unemployed | 545 | 2,954 | 5,429 | |
Civlian Workforce | 11,641 | 57,982 | 122,380 | |
Military Workforce | 66 | 278 | 441 | |
Total Households | 6,179 | 31,209 | 68,385 | |
Family Households | 5,282 | 25,957 | 55,399 | |
Non-Family Households | 897 | 5,252 | 12,986 | |
Married Couple | 4,210 | 19,593 | 42,109 | |
Other Family | 1,072 | 6,364 | 13,290 | |
Married w/Child | 2,215 | 9,940 | 21,205 | |
Single Male w/Child | 12 | 650 | 1,334 | |
Single Female w/Child | 339 | 2,306 | 5,114 |
Population Change Last Two Decades - Plus Projection
2000 | % | 2010 | % | 2020 | % | 2030 | |
---|---|---|---|---|---|---|---|
Texas | 20,851,820 | +21 | 25,145,561 | +18 | 29,677,668 | +18 | 34,894,452 |
Johnson County | 126,811 | +19 | 150,934 | +14 | 171,701 | +13 | 194,098 |
Tarrant County | 1,446,219 | +25 | 1,809,034 | +19 | 2,143,755 | +17 | 2,507,170 |
Ellis County | 111,360 | +34 | 149,610 | +19 | 177,721 | +18 | 209,581 |
Dallas County | 2,218,899 | +7 | 2,368,139 | +15 | 2,734,111 | +14 | 3,106,298 |
Total Working Age Population:
Total Households:
Total Working Age Population:
Total Households:
Total Working Age Population:
Total Households: