Retail Space
6249 Altamesa Boulevard Fort Worth, TX 76132
6249 Altamesa Boulevard Fort Worth, TX 76132
Details & Description
Property Highlights
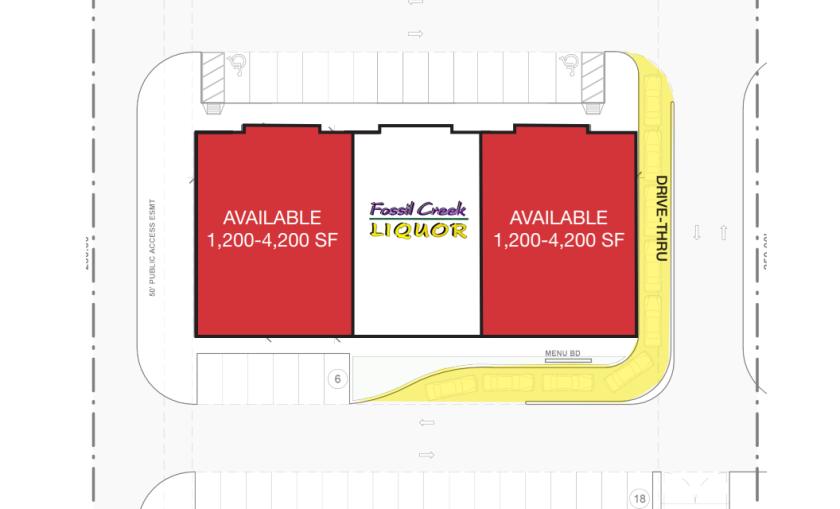
- • Suite 100
- • End Cap with Drive-Thru Available
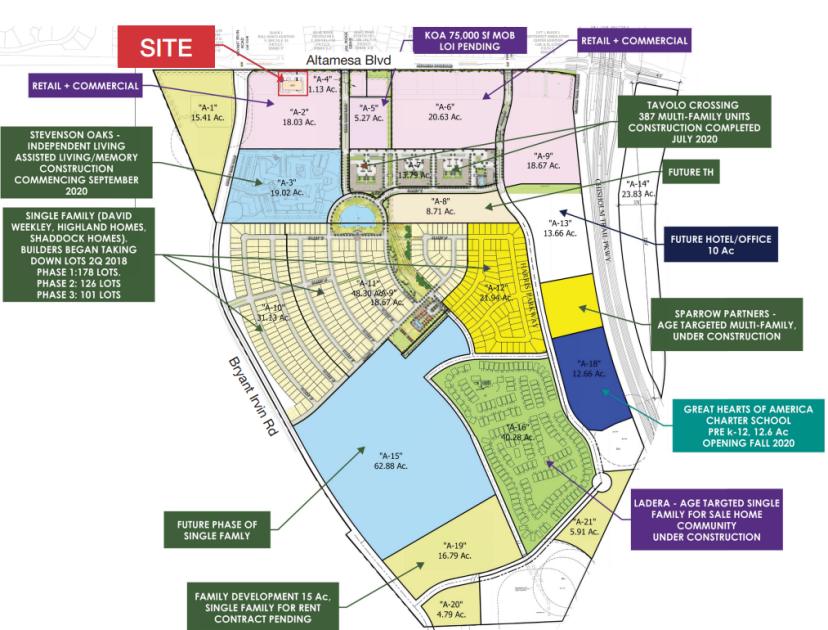
- • 387 Apartment Units Behind Property
- • Adjacent to 7-11 Under Construction
- • Surrounded by Strong Residential Demographics
- • Located in the Southwest Hospital District
Listing Agents

Hunter Hayes
O: 817-872-3911
M: 817-487-7200
hhayes@nairl.com
O: 817-872-3911
M: 817-487-7200
hhayes@nairl.com
While we strive to provide the most accurate information, all listing information, and demographic data, is provided by third-parties. As such, MyEListing will not be responsible for the accuracy of the information. It is strongly recommended that you verify all information with the listing agent, and any relevant agencies, prior to making any decisions.