Retail Space
901 Keller Parkway Keller, TX 76248
901 Keller Parkway Keller, TX 76248
Details & Description
Property Highlights
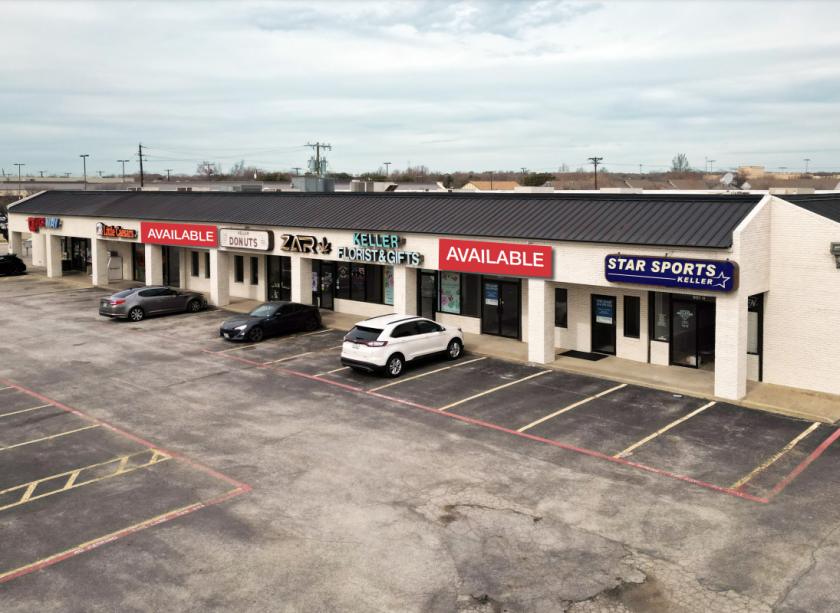
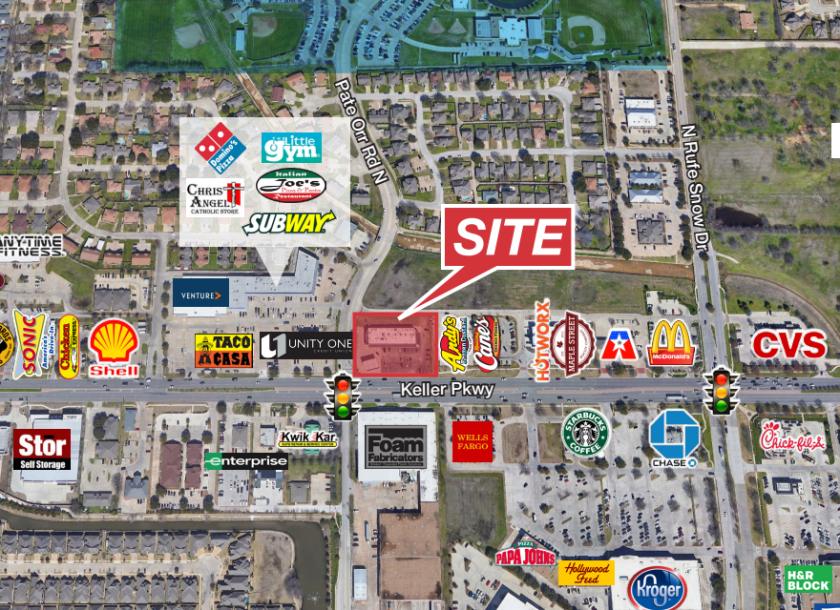
- • Vast Frontage on Keller Parkway
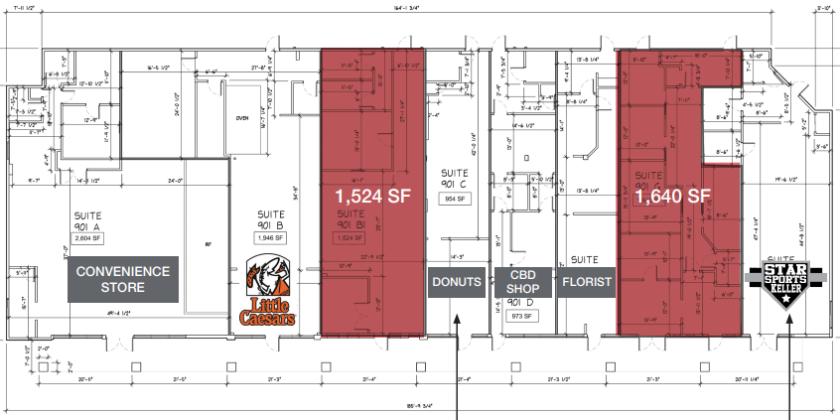
- • Two (2) Second Generation Spaces Available
- • Ample Parking (Front Lot)
- • Storefronts Will Be Replaced Soon
Additional Photos

Listing Agents

Hunter Hayes
O: 817-872-3911
M: 817-487-7200
hhayes@nairl.com
O: 817-872-3911
M: 817-487-7200
hhayes@nairl.com
While we strive to provide the most accurate information, all listing information, and demographic data, is provided by third-parties. As such, MyEListing will not be responsible for the accuracy of the information. It is strongly recommended that you verify all information with the listing agent, and any relevant agencies, prior to making any decisions.


