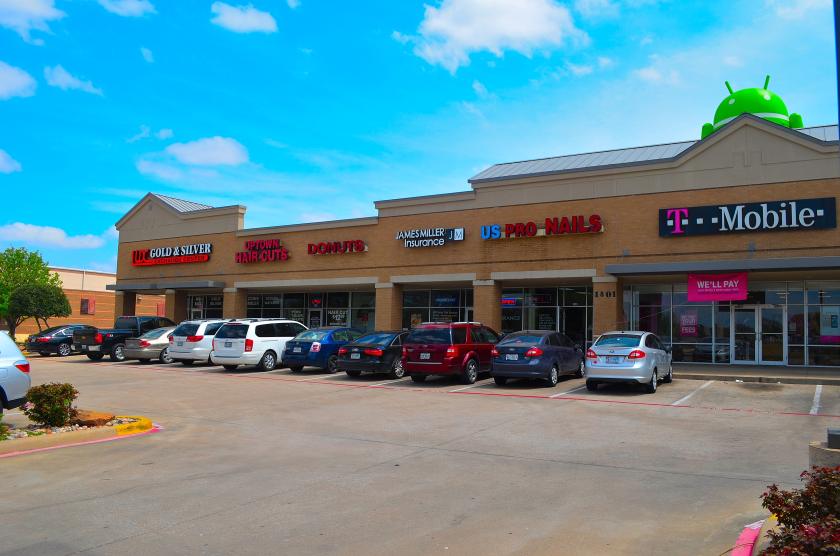
1-Mile | 3-Miles | 5-Miles | ||
---|---|---|---|---|
Total Population | 8,344 | 81,806 | 250,285 | |
Population Median Age | 40 | 38 | 36 | |
Population by Age | 0-9 Yrs | 724 (8%) | 10675 (13%) | 34363 (13%) |
10-19 Yrs | 1067 (12%) | 10900 (13%) | 33362 (13%) | |
20-29 Yrs | 1068 (12%) | 11572 (14%) | 42149 (16%) | |
30-39 Yrs | 1247 (14%) | 11041 (13%) | 34203 (13%) | |
40-49 Yrs | 1489 (17%) | 11290 (13%) | 31888 (12%) | |
50-59 Yrs | 1093 (13%) | 10160 (12%) | 28620 (11%) | |
60-69 Yrs | 948 (11%) | 8207 (10%) | 24198 (9%) | |
70+ Yrs | 709 (8%) | 7960 (9%) | 21501 (8%) | |
Median HH Income | $72,543 | $64,477 | $56,034 | |
Total Household Income | < 24K | 460 (13%) | 5390 (17%) | 18873 (20%) |
25-49K | 695 (21%) | 6729 (21%) | 23446 (25%) | |
50-74K | 548 (16%) | 5758 (18%) | 17627 (18%) | |
75-99K | 437 (13%) | 3741 (12%) | 10979 (11%) | |
100-199K | 915 (27%) | 7592 (24%) | 18258 (19%) | |
200K+ | 248 (7%) | 1782 (5%) | 4418 (4%) | |
Highest Education Level | No Diploma | 519 | 5167 | 22493 |
Diploma or GED | 1363 | 13055 | 39035 | |
Some College | 1568 | 13787 | 40434 | |
Assoc. Degree | 453 | 4200 | 12491 | |
Bachelors Degree | 1288 | 12483 | 32484 | |
Higher Degree | 920 | 6198 | 16495 | |
Total Housing Units | 3,903 | 34,214 | 104,192 | |
--Owner-Occupied | 1,652 | 17,880 | 46,486 | |
--Renter-Occupied | 1,651 | 13,112 | 47,114 | |
Owner-Occupied Values | < 100K | 103 | 2089 | 7090 |
100-199K | 619 | 7335 | 19253 | |
200-299K | 589 | 6103 | 14134 | |
300-399K | 246 | 1500 | 3806 | |
400-499K | 72 | 552 | 1240 | |
500K+ | 23 | 301 | 963 | |
Total Working Age Population | 6,983 | 64,574 | 196,103 | |
In Work Force | 5,155 | 43,888 | 132,284 | |
Not In Work Force | 1,829 | 20,686 | 63,819 | |
Workforce Employed | 4,754 | 41,792 | 124,780 | |
Workforce Unemployed | 394 | 1,986 | 7,344 | |
Civlian Workforce | 5,148 | 43,778 | 132,124 | |
Military Workforce | 7 | 110 | 160 | |
Total Households | 3,303 | 30,992 | 93,600 | |
Family Households | 2,105 | 20,427 | 58,728 | |
Non-Family Households | 1,198 | 10,565 | 34,872 | |
Married Couple | 1,394 | 13,256 | 38,315 | |
Other Family | 711 | 7,172 | 20,413 | |
Married w/Child | 507 | 5,216 | 15,772 | |
Single Male w/Child | 35 | 744 | 2,415 | |
Single Female w/Child | 228 | 2,967 | 8,712 |
Population Change Last Two Decades - Plus Projection
2000 | % | 2010 | % | 2020 | % | 2030 | |
---|---|---|---|---|---|---|---|
Texas | 20,851,820 | +21 | 25,145,561 | +18 | 29,677,668 | +18 | 34,894,452 |
Tarrant County | 1,446,219 | +25 | 1,809,034 | +19 | 2,143,755 | +17 | 2,507,170 |
Total Working Age Population:
Total Households:
Total Working Age Population:
Total Households:
Total Working Age Population:
Total Households: