Industrial Properties
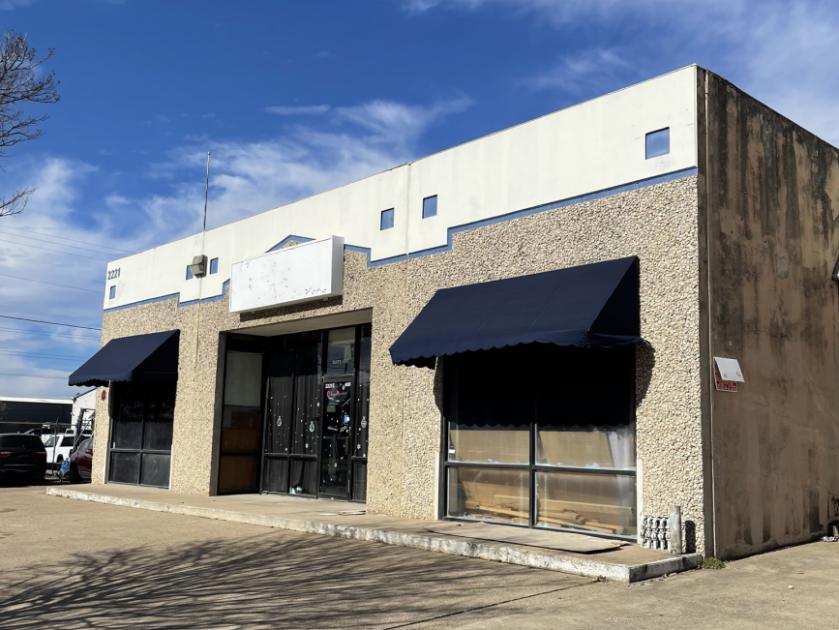
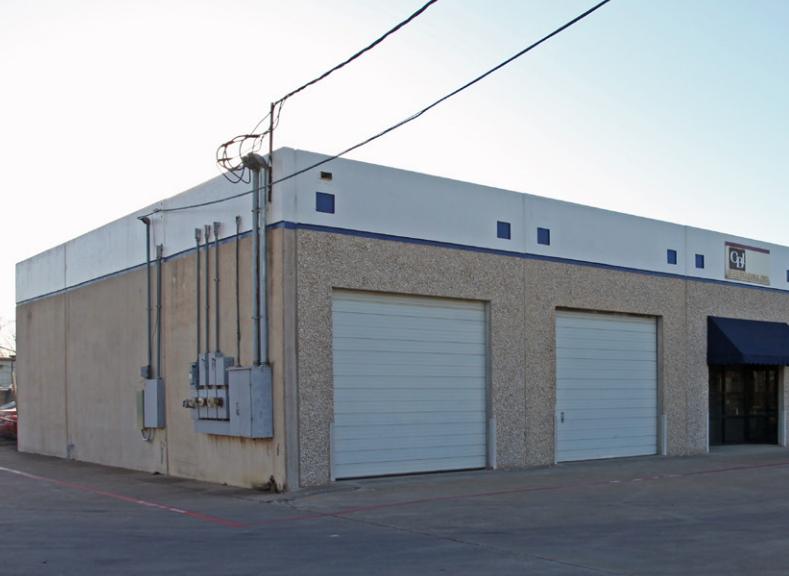
2221 East Grauwyler Road Irving, TX 75061
2221 East Grauwyler Road Irving, TX 75061
Details & Description
Property Highlights
- • High-End Finish Out
- • 3P Heavy Power
- • Ample Parking
- • 15’ Clear Height
- • 11 Grade Level Doors
Listing Agents

Chase Miller
O: 214-256-7131
M: 214-770-5495
cmiller@nairl.com
O: 214-256-7131
M: 214-770-5495
cmiller@nairl.com
Robert Blankinship
O: 214-256-7115
M: 214-500-6326
rblankinship@nairl.com
O: 214-256-7115
M: 214-500-6326
rblankinship@nairl.com
While we strive to provide the most accurate information, all listing information, and demographic data, is provided by third-parties. As such, MyEListing will not be responsible for the accuracy of the information. It is strongly recommended that you verify all information with the listing agent, and any relevant agencies, prior to making any decisions.