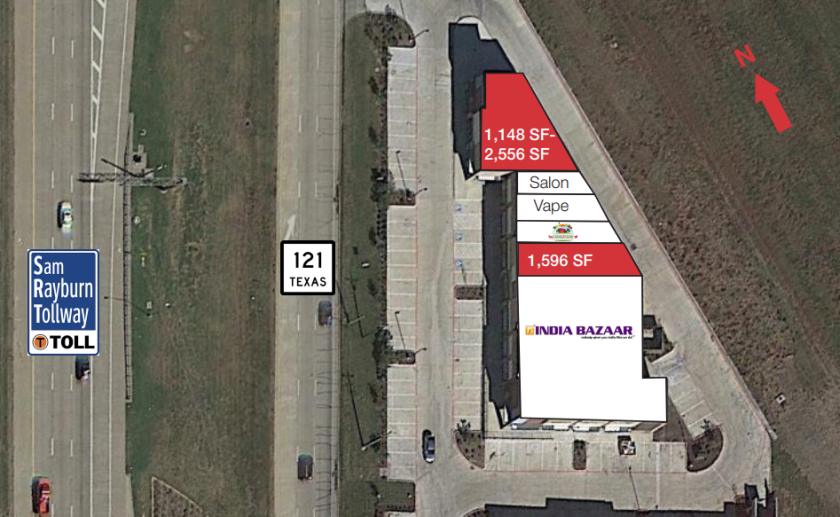
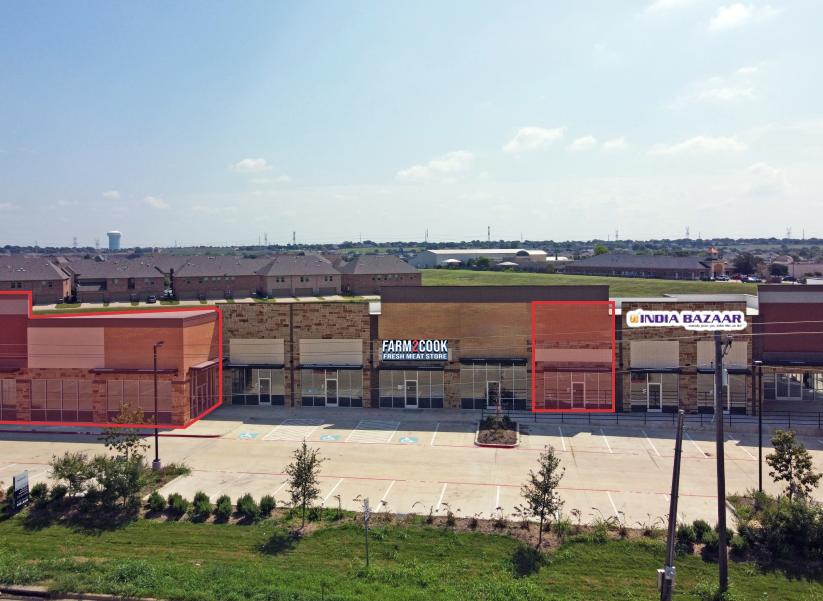
1-Mile | 3-Miles | 5-Miles | ||
---|---|---|---|---|
Total Population | 12,861 | 77,739 | 240,402 | |
Population Median Age | 36 | 37 | 36 | |
Population by Age | 0-9 Yrs | 1534 (11%) | 8677 (11%) | 28885 (12%) |
10-19 Yrs | 1538 (11%) | 10748 (13%) | 30392 (12%) | |
20-29 Yrs | 1941 (15%) | 10698 (13%) | 36339 (15%) | |
30-39 Yrs | 2423 (18%) | 12720 (16%) | 40851 (16%) | |
40-49 Yrs | 1828 (14%) | 12039 (15%) | 34675 (14%) | |
50-59 Yrs | 2067 (16%) | 11590 (14%) | 33465 (13%) | |
60-69 Yrs | 804 (6%) | 6764 (8%) | 20891 (8%) | |
70+ Yrs | 724 (5%) | 4505 (5%) | 14904 (6%) | |
Median HH Income | $86,910 | $91,060 | $79,803 | |
Total Household Income | < 24K | 188 (3%) | 2111 (7%) | 8666 (9%) |
25-49K | 591 (12%) | 4277 (15%) | 17408 (19%) | |
50-74K | 1109 (23%) | 4675 (16%) | 16608 (18%) | |
75-99K | 1042 (21%) | 4525 (16%) | 13325 (14%) | |
100-199K | 1422 (29%) | 8581 (30%) | 24872 (27%) | |
200K+ | 417 (8%) | 3771 (13%) | 9608 (10%) | |
Highest Education Level | No Diploma | 374 | 3478 | 15764 |
Diploma or GED | 1352 | 8736 | 32084 | |
Some College | 1850 | 10720 | 35053 | |
Assoc. Degree | 645 | 3784 | 11254 | |
Bachelors Degree | 3537 | 18573 | 49903 | |
Higher Degree | 1335 | 8321 | 23207 | |
Total Housing Units | 5,025 | 29,764 | 96,598 | |
--Owner-Occupied | 2,149 | 16,001 | 46,549 | |
--Renter-Occupied | 2,621 | 11,939 | 43,938 | |
Owner-Occupied Values | < 100K | 90 | 664 | 2021 |
100-199K | 79 | 1389 | 8247 | |
200-299K | 472 | 4797 | 15227 | |
300-399K | 741 | 4279 | 10259 | |
400-499K | 382 | 2650 | 5862 | |
500K+ | 384 | 2222 | 4932 | |
Total Working Age Population | 10,376 | 62,839 | 192,763 | |
In Work Force | 7,940 | 46,294 | 144,766 | |
Not In Work Force | 2,436 | 16,545 | 47,996 | |
Workforce Employed | 7,548 | 44,496 | 139,436 | |
Workforce Unemployed | 392 | 1,778 | 5,216 | |
Civlian Workforce | 7,940 | 46,274 | 144,653 | |
Military Workforce | 0 | 20 | 114 | |
Total Households | 4,770 | 27,940 | 90,486 | |
Family Households | 3,107 | 19,205 | 58,793 | |
Non-Family Households | 1,662 | 8,735 | 31,693 | |
Married Couple | 2,546 | 15,157 | 44,869 | |
Other Family | 562 | 4,047 | 13,924 | |
Married w/Child | 1,284 | 7,175 | 20,290 | |
Single Male w/Child | 51 | 288 | 1,404 | |
Single Female w/Child | 209 | 1,835 | 6,091 |
Population Change Last Two Decades - Plus Projection
2000 | % | 2010 | % | 2020 | % | 2030 | |
---|---|---|---|---|---|---|---|
Texas | 20,851,820 | +21 | 25,145,561 | +18 | 29,677,668 | +18 | 34,894,452 |
Denton County | 432,976 | +53 | 662,614 | +36 | 897,953 | +37 | 1,234,110 |
Dallas County | 2,218,899 | +7 | 2,368,139 | +15 | 2,734,111 | +14 | 3,106,298 |
Total Working Age Population:
Total Households:
Total Working Age Population:
Total Households:
Total Working Age Population:
Total Households: