Retail Space
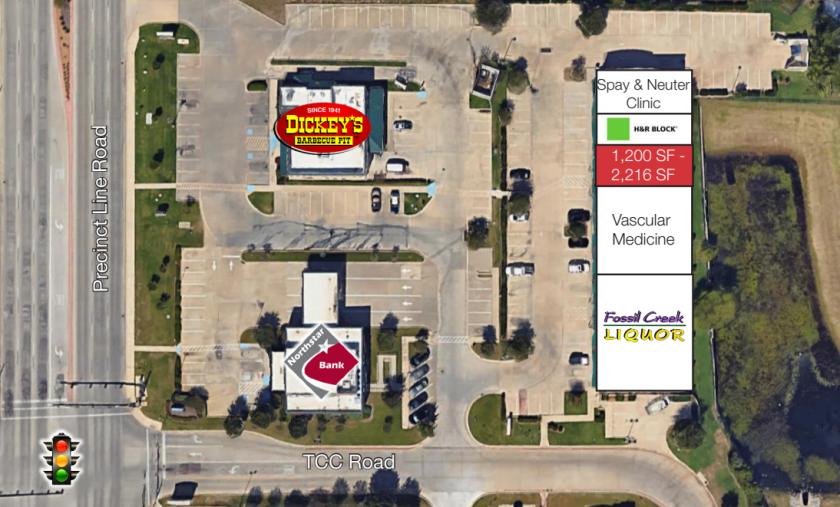
1856 Precinct Line Road Hurst, TX 76054
1856 Precinct Line Road Hurst, TX 76054

Details & Description
Property Highlights
- • Suite 104
- • 2nd Gen Fitness Space: Available Now
- • Walmart Shadowed Strip Center
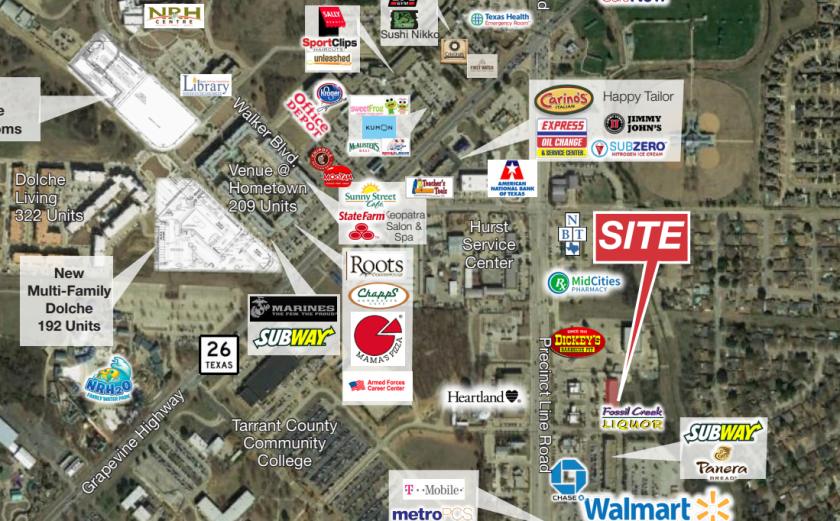
- • Close Proximity to SH 121
- • Multiple Ingress/Egress Access Points
Additional Photos

Listing Agents

Hunter Hayes
O: 817-872-3911
M: 817-487-7200
hhayes@nairl.com
O: 817-872-3911
M: 817-487-7200
hhayes@nairl.com

Josh Mann
O: 214-256-7100
M: 972-971-8336
jmann@nairl.com
O: 214-256-7100
M: 972-971-8336
jmann@nairl.com
While we strive to provide the most accurate information, all listing information, and demographic data, is provided by third-parties. As such, MyEListing will not be responsible for the accuracy of the information. It is strongly recommended that you verify all information with the listing agent, and any relevant agencies, prior to making any decisions.


