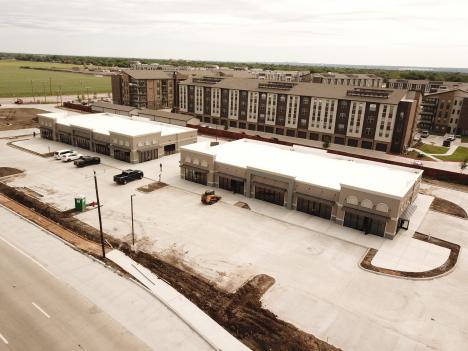
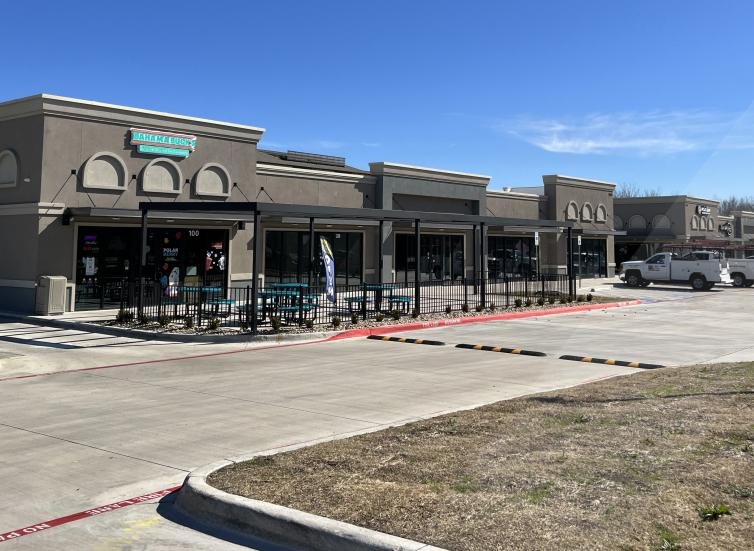
1-Mile | 3-Miles | 5-Miles | ||
---|---|---|---|---|
Total Population | 11,886 | 102,915 | 257,912 | |
Population Median Age | 35 | 35 | 33 | |
Population by Age | 0-9 Yrs | 1479 (12%) | 14474 (14%) | 40558 (15%) |
10-19 Yrs | 2211 (18%) | 17320 (16%) | 43388 (16%) | |
20-29 Yrs | 1590 (13%) | 14181 (13%) | 39256 (15%) | |
30-39 Yrs | 1287 (10%) | 14335 (13%) | 35654 (13%) | |
40-49 Yrs | 2061 (17%) | 14016 (13%) | 34266 (13%) | |
50-59 Yrs | 1407 (11%) | 12618 (12%) | 29744 (11%) | |
60-69 Yrs | 1190 (10%) | 9889 (9%) | 21792 (8%) | |
70+ Yrs | 660 (5%) | 6083 (5%) | 13254 (5%) | |
Median HH Income | $74,947 | $70,797 | $61,305 | |
Total Household Income | < 24K | 212 (5%) | 3539 (10%) | 12671 (15%) |
25-49K | 500 (13%) | 6981 (21%) | 18970 (23%) | |
50-74K | 1102 (30%) | 7018 (21%) | 16898 (21%) | |
75-99K | 636 (17%) | 5162 (15%) | 11653 (14%) | |
100-199K | 1106 (30%) | 8934 (27%) | 17350 (21%) | |
200K+ | 68 (1%) | 1194 (3%) | 2081 (2%) | |
Highest Education Level | No Diploma | 1297 | 12184 | 35938 |
Diploma or GED | 2339 | 16953 | 43739 | |
Some College | 1637 | 14465 | 32083 | |
Assoc. Degree | 506 | 5409 | 10813 | |
Bachelors Degree | 1339 | 11225 | 22225 | |
Higher Degree | 381 | 4404 | 9194 | |
Total Housing Units | 3,918 | 34,834 | 84,916 | |
--Owner-Occupied | 2,461 | 21,058 | 47,181 | |
--Renter-Occupied | 1,163 | 11,770 | 32,444 | |
Owner-Occupied Values | < 100K | 225 | 2476 | 7947 |
100-199K | 1362 | 10503 | 24597 | |
200-299K | 722 | 6100 | 11305 | |
300-399K | 94 | 1709 | 2769 | |
400-499K | 2 | 72 | 237 | |
500K+ | 56 | 198 | 325 | |
Total Working Age Population | 9,105 | 77,403 | 191,181 | |
In Work Force | 6,535 | 54,421 | 132,171 | |
Not In Work Force | 2,570 | 22,982 | 59,010 | |
Workforce Employed | 5,915 | 51,410 | 124,355 | |
Workforce Unemployed | 617 | 2,979 | 7,707 | |
Civlian Workforce | 6,533 | 54,389 | 132,062 | |
Military Workforce | 2 | 32 | 109 | |
Total Households | 3,624 | 32,828 | 79,624 | |
Family Households | 2,850 | 24,278 | 59,277 | |
Non-Family Households | 774 | 8,551 | 20,347 | |
Married Couple | 2,124 | 17,479 | 40,123 | |
Other Family | 725 | 6,798 | 19,154 | |
Married w/Child | 927 | 7,998 | 19,126 | |
Single Male w/Child | 118 | 1,072 | 2,282 | |
Single Female w/Child | 287 | 2,552 | 7,643 |
Population Change Last Two Decades - Plus Projection
2000 | % | 2010 | % | 2020 | % | 2030 | |
---|---|---|---|---|---|---|---|
Texas | 20,851,820 | +21 | 25,145,561 | +18 | 29,677,668 | +18 | 34,894,452 |
Tarrant County | 1,446,219 | +25 | 1,809,034 | +19 | 2,143,755 | +17 | 2,507,170 |
Dallas County | 2,218,899 | +7 | 2,368,139 | +15 | 2,734,111 | +14 | 3,106,298 |
Total Working Age Population:
Total Households:
Total Working Age Population:
Total Households:
Total Working Age Population:
Total Households: