Office Space
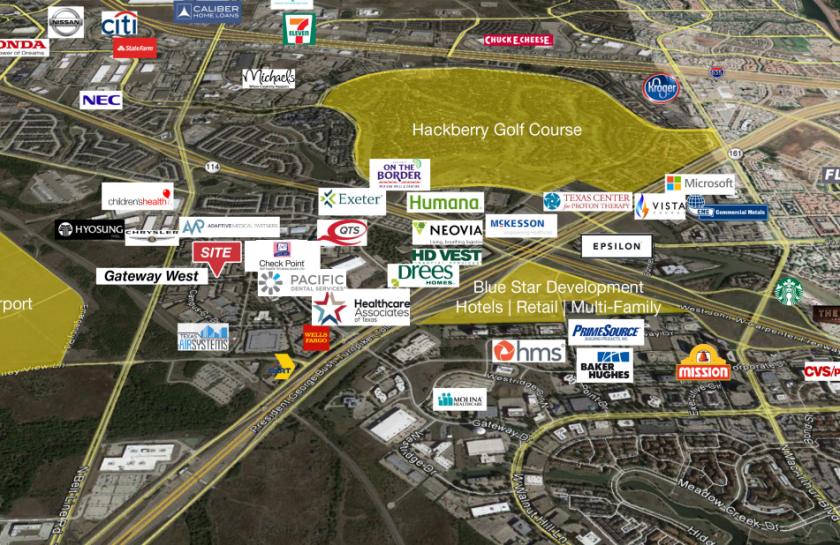
3011 Gateway Drive Irving, TX 75063
3011 Gateway Drive Irving, TX 75063
Details & Description
Property Highlights
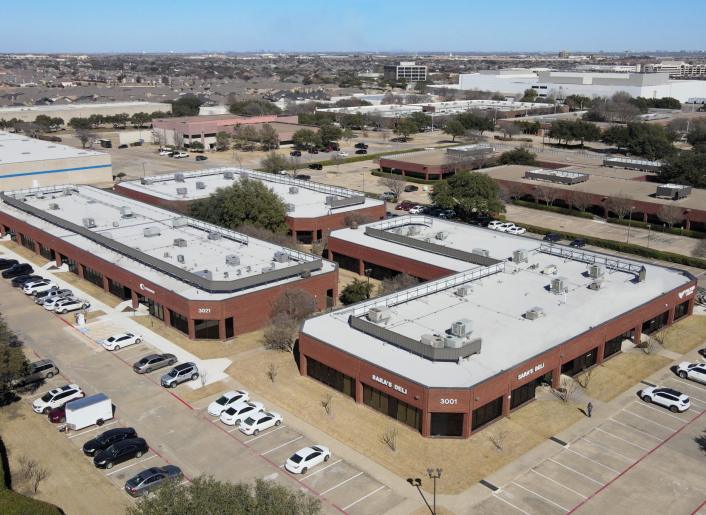
- • Building Signage Available for Small Tenants
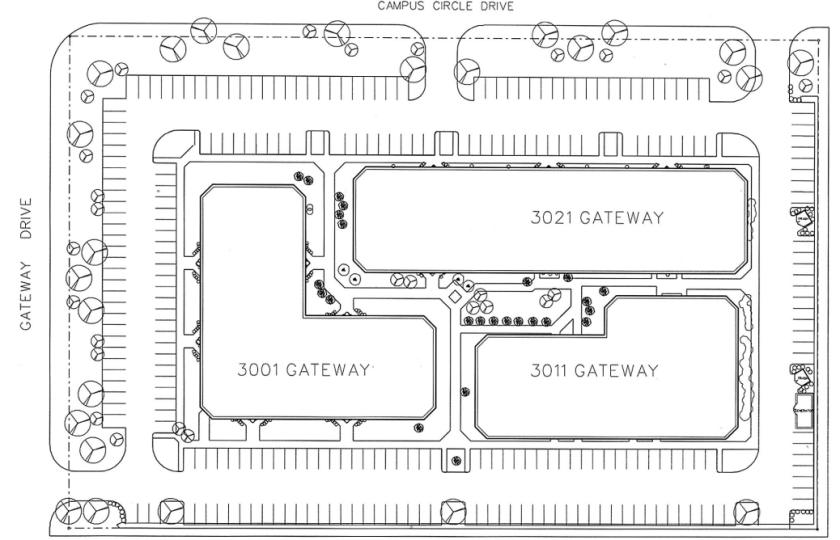
- • Well-Maintained Parking Lot
- • 100% Wet Sprinkler System
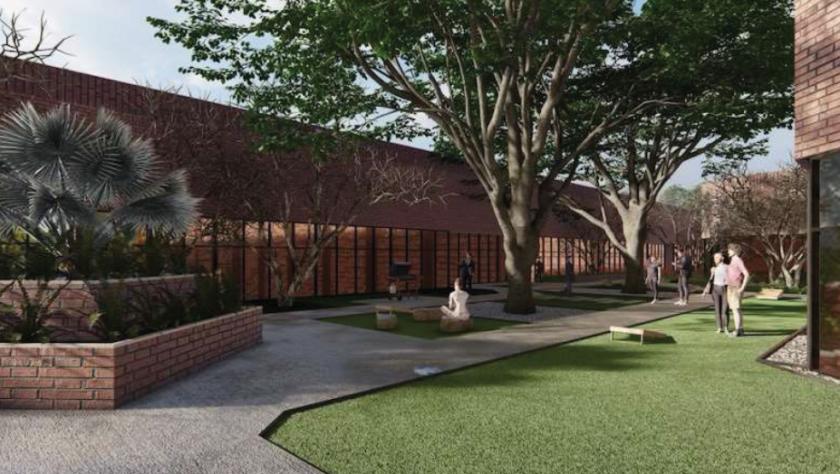
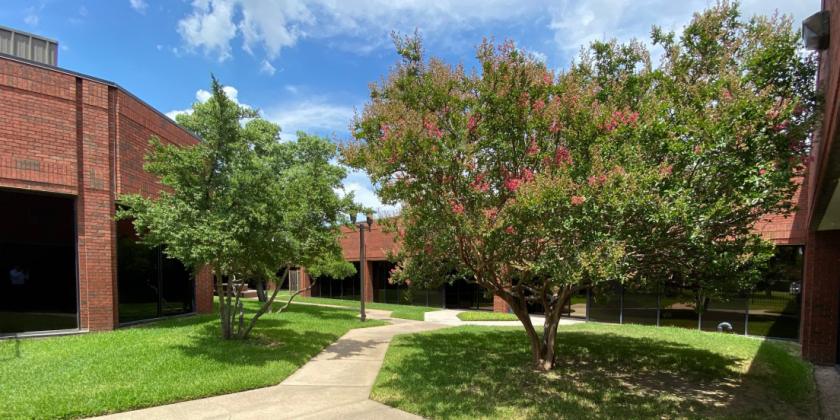
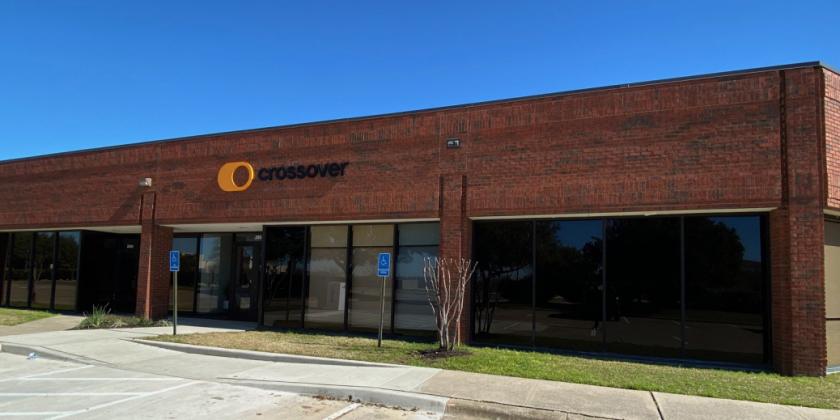
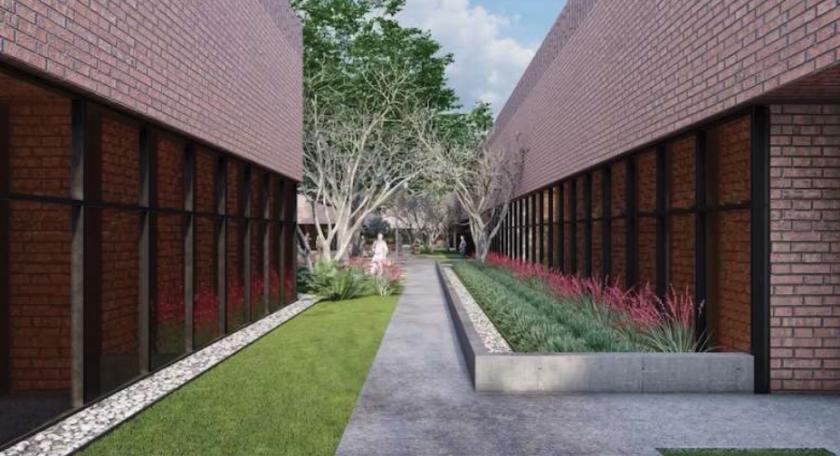
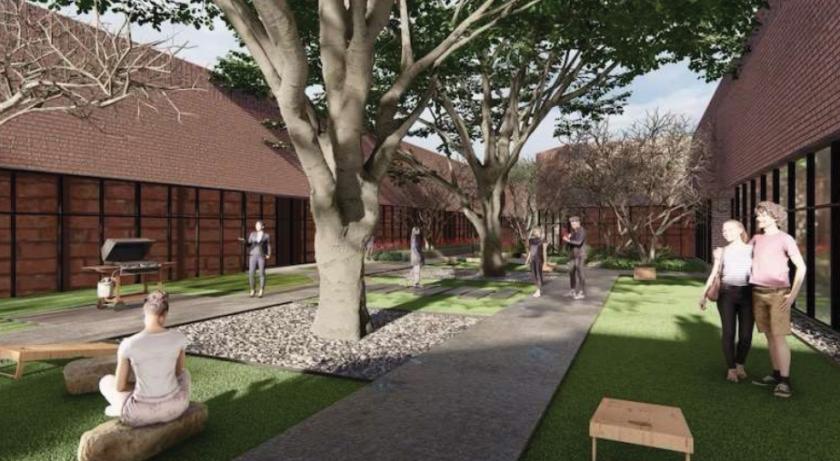
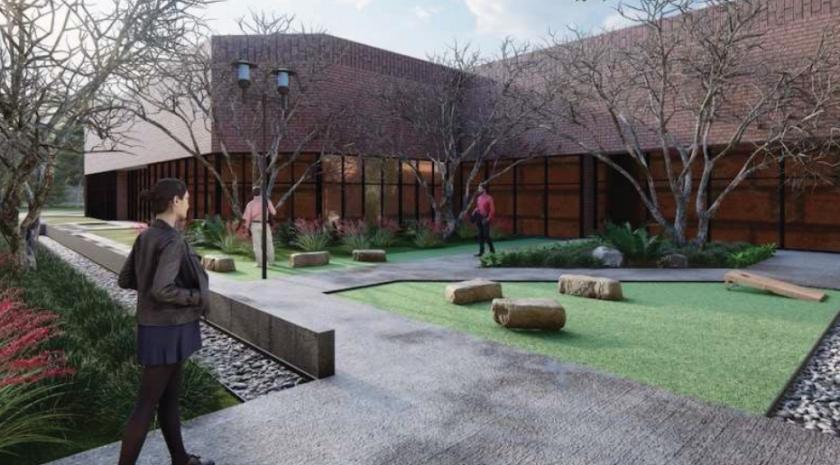
Additional Photos
Listing Agents

Zach Stevens
O: 214-256-7149
M: 214-918-0330
zstevens@nairl.com
O: 214-256-7149
M: 214-918-0330
zstevens@nairl.com
While we strive to provide the most accurate information, all listing information, and demographic data, is provided by third-parties. As such, MyEListing will not be responsible for the accuracy of the information. It is strongly recommended that you verify all information with the listing agent, and any relevant agencies, prior to making any decisions.