Office Space
3600 William D Tate Avenue Grapevine, TX 76051
3600 William D Tate Avenue Grapevine, TX 76051

Details & Description
Property Highlights
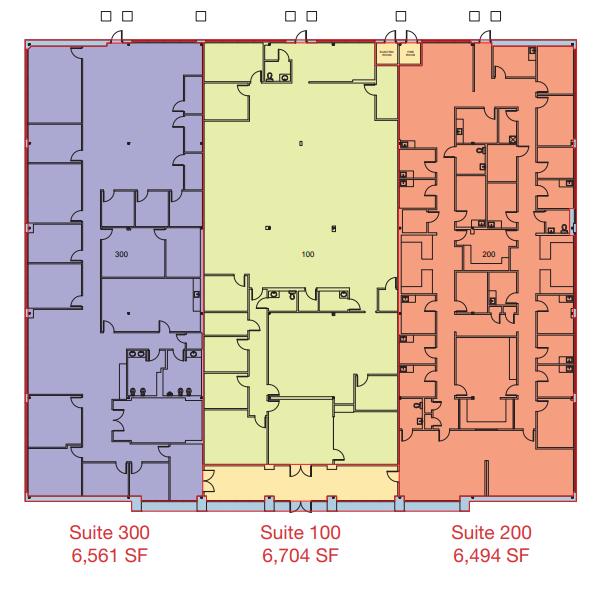
- • 19,759 SF 3-Tenant Office/Medical Building
- • Entire Building Can be Made Available
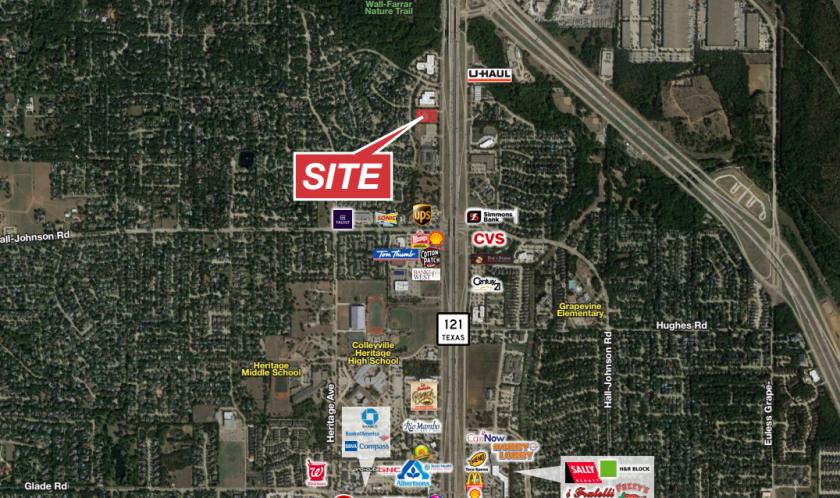
- • Excellent Frontage to Highway 121
- • High End Interior Finishes
- • Strong Market Demographics in Grapevine
Listing Agents

Bobby Montgomery
O: 817-872-3908
M: 817-999-2663
bmontgomery@nairl.com
O: 817-872-3908
M: 817-999-2663
bmontgomery@nairl.com

Logan May
O: 817-872-3909
M: 325-642-4312
lmay@nairl.com
O: 817-872-3909
M: 325-642-4312
lmay@nairl.com

Jon McDaniel
O: 817-872-3902
M: 817-291-4451
jmcdaniel@nairl.com
O: 817-872-3902
M: 817-291-4451
jmcdaniel@nairl.com
While we strive to provide the most accurate information, all listing information, and demographic data, is provided by third-parties. As such, MyEListing will not be responsible for the accuracy of the information. It is strongly recommended that you verify all information with the listing agent, and any relevant agencies, prior to making any decisions.