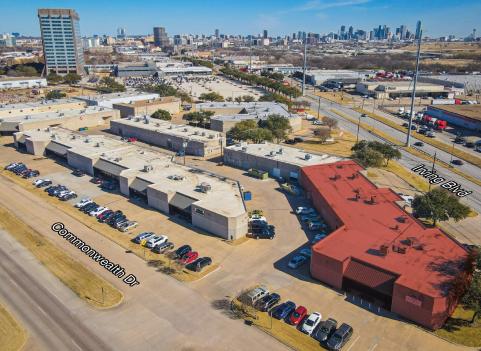
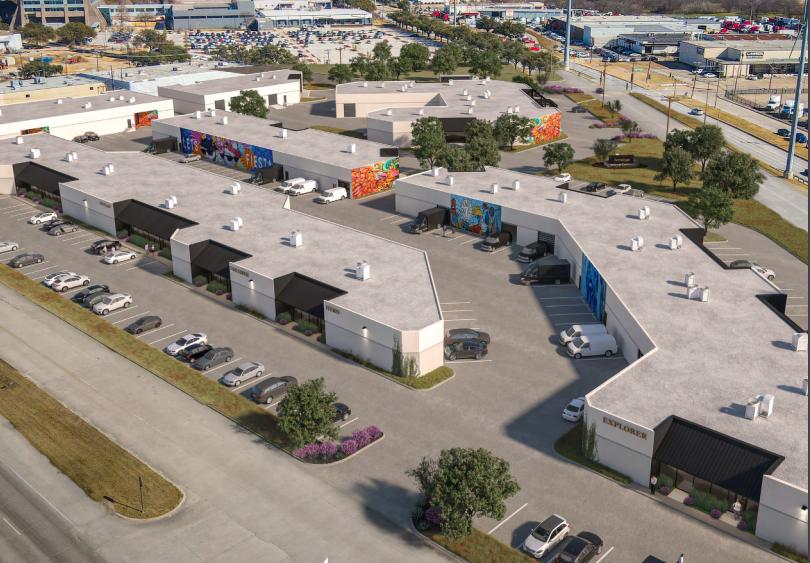
Industrial Properties
3141 Irving Boulevard Dallas, TX 75247
3141 Irving Boulevard Dallas, TX 75247
Details & Description
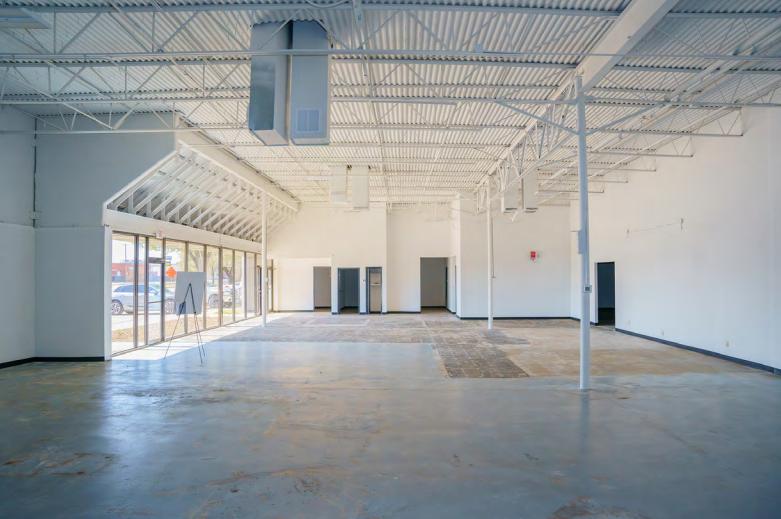
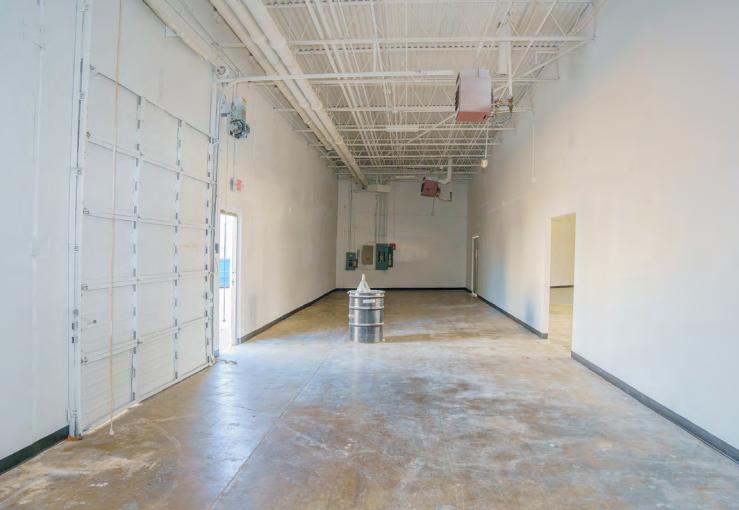
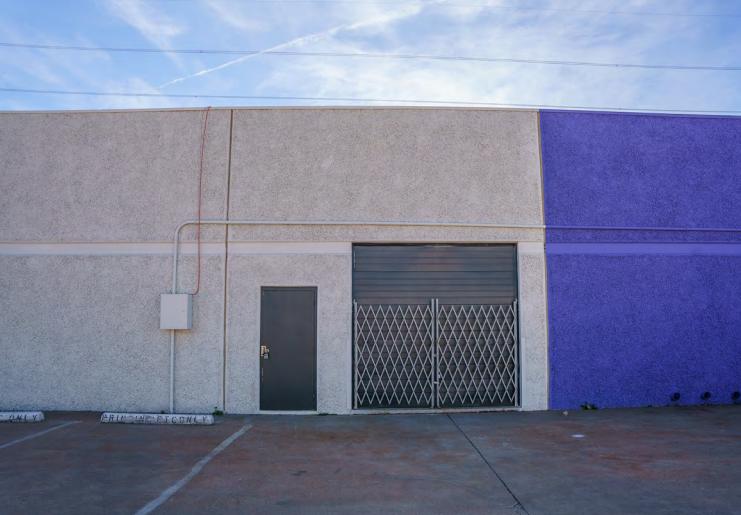
Property Highlights
- • Six Building Park
- • 3/1000 Parking
- • Centrally Located Near Love Field
- • 12’ - 16’ Clear Height
- • 100% HVAC
- • Major Capital Improvements
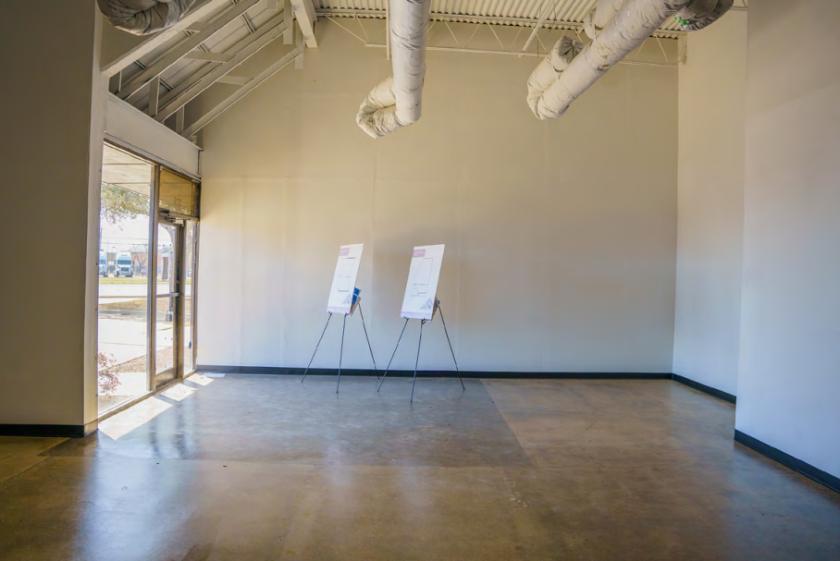
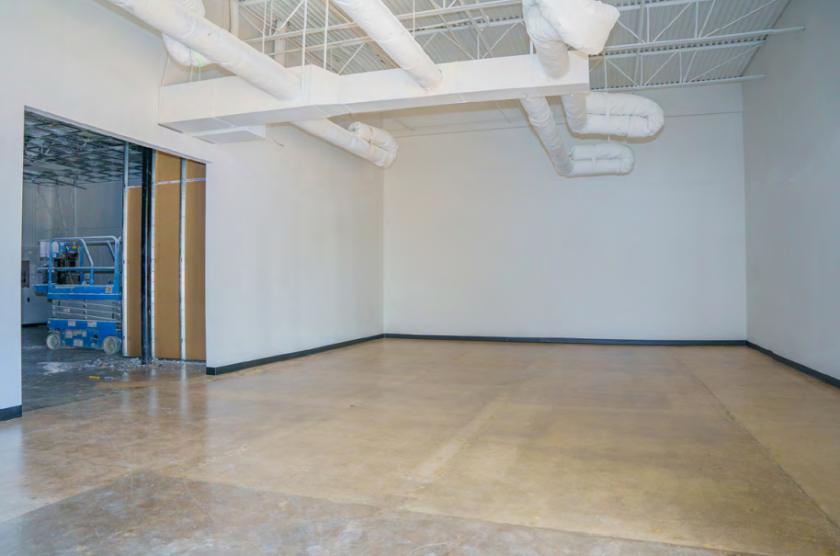
Additional Photos

Listing Agents

Everett James
O: 214-256-7170
M: 214-904-9166
ejames@nairl.com
O: 214-256-7170
M: 214-904-9166
ejames@nairl.com
While we strive to provide the most accurate information, all listing information, and demographic data, is provided by third-parties. As such, MyEListing will not be responsible for the accuracy of the information. It is strongly recommended that you verify all information with the listing agent, and any relevant agencies, prior to making any decisions.