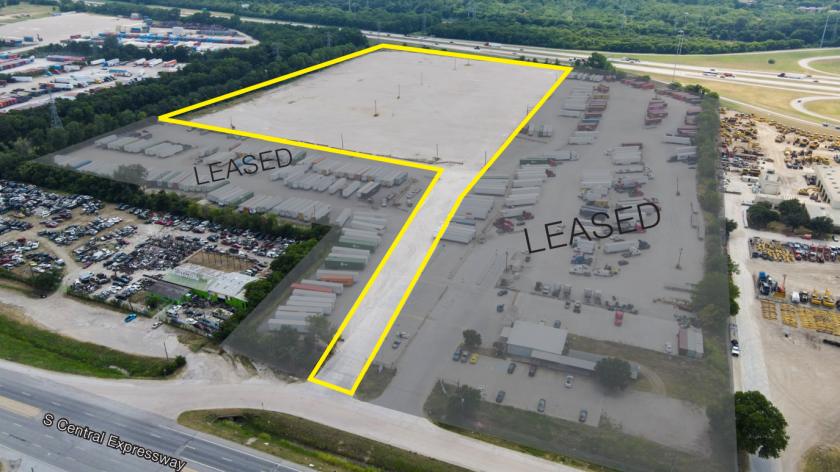
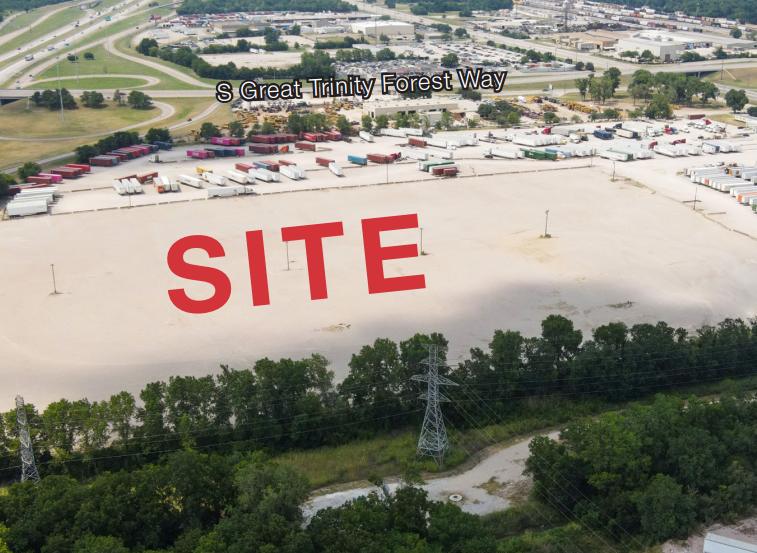
1-Mile | 3-Miles | 5-Miles | ||
---|---|---|---|---|
Total Population | 2,742 | 51,470 | 179,413 | |
Population Median Age | 35 | 34 | 35 | |
Population by Age | 0-9 Yrs | 495 (18%) | 9456 (18%) | 29872 (16%) |
10-19 Yrs | 352 (12%) | 8389 (16%) | 29850 (16%) | |
20-29 Yrs | 502 (18%) | 6874 (13%) | 25018 (13%) | |
30-39 Yrs | 294 (10%) | 6308 (12%) | 22750 (12%) | |
40-49 Yrs | 266 (9%) | 5554 (10%) | 21257 (11%) | |
50-59 Yrs | 344 (12%) | 5793 (11%) | 19622 (10%) | |
60-69 Yrs | 237 (8%) | 4681 (9%) | 16243 (9%) | |
70+ Yrs | 252 (9%) | 4416 (8%) | 14802 (8%) | |
Median HH Income | $25,916 | $27,127 | $33,258 | |
Total Household Income | < 24K | 464 (48%) | 8304 (46%) | 22273 (38%) |
25-49K | 294 (30%) | 4960 (28%) | 16977 (29%) | |
50-74K | 120 (12%) | 2233 (12%) | 9309 (16%) | |
75-99K | 43 (4%) | 1141 (6%) | 4495 (7%) | |
100-199K | 21 (2%) | 842 (4%) | 4329 (7%) | |
200K+ | 17 (1%) | 227 (1%) | 667 (1%) | |
Highest Education Level | No Diploma | 521 | 9212 | 33756 |
Diploma or GED | 774 | 11795 | 38432 | |
Some College | 232 | 6543 | 20994 | |
Assoc. Degree | 64 | 986 | 4174 | |
Bachelors Degree | 60 | 1540 | 6751 | |
Higher Degree | 32 | 559 | 2994 | |
Total Housing Units | 1,060 | 20,176 | 64,458 | |
--Owner-Occupied | 421 | 8,225 | 29,941 | |
--Renter-Occupied | 539 | 9,481 | 28,111 | |
Owner-Occupied Values | < 100K | 305 | 5559 | 18018 |
100-199K | 98 | 2192 | 9620 | |
200-299K | 9 | 290 | 1448 | |
300-399K | 0 | 55 | 398 | |
400-499K | 0 | 11 | 114 | |
500K+ | 8 | 118 | 342 | |
Total Working Age Population | 2,010 | 36,341 | 131,038 | |
In Work Force | 933 | 18,354 | 69,593 | |
Not In Work Force | 1,077 | 17,987 | 61,445 | |
Workforce Employed | 815 | 17,052 | 64,960 | |
Workforce Unemployed | 119 | 1,302 | 4,600 | |
Civlian Workforce | 933 | 18,354 | 69,560 | |
Military Workforce | 0 | 0 | 33 | |
Total Households | 959 | 17,707 | 58,051 | |
Family Households | 571 | 11,312 | 38,086 | |
Non-Family Households | 388 | 6,395 | 19,965 | |
Married Couple | 152 | 3,903 | 17,549 | |
Other Family | 419 | 7,409 | 20,538 | |
Married w/Child | 52 | 1,657 | 7,909 | |
Single Male w/Child | 37 | 480 | 1,934 | |
Single Female w/Child | 187 | 3,259 | 8,087 |
Population Change Last Two Decades - Plus Projection
2000 | % | 2010 | % | 2020 | % | 2030 | |
---|---|---|---|---|---|---|---|
Texas | 20,851,820 | +21 | 25,145,561 | +18 | 29,677,668 | +18 | 34,894,452 |
Dallas County | 2,218,899 | +7 | 2,368,139 | +15 | 2,734,111 | +14 | 3,106,298 |
Total Working Age Population:
Total Households:
Total Working Age Population:
Total Households:
Total Working Age Population:
Total Households: