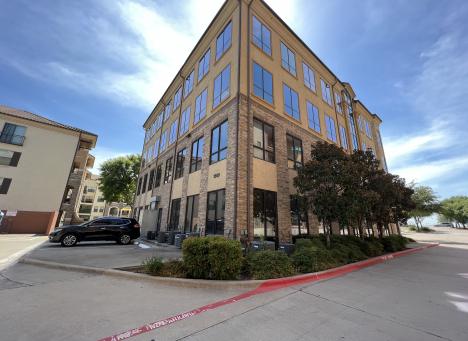
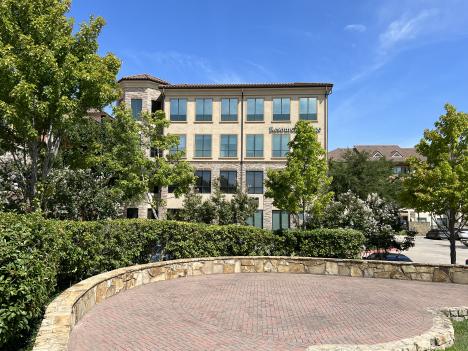
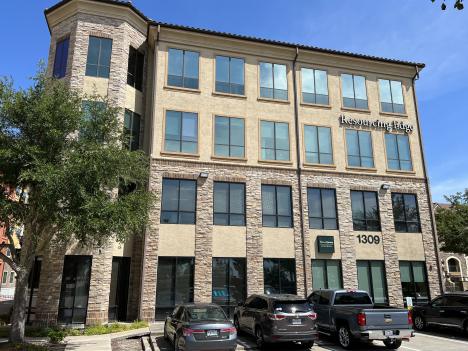
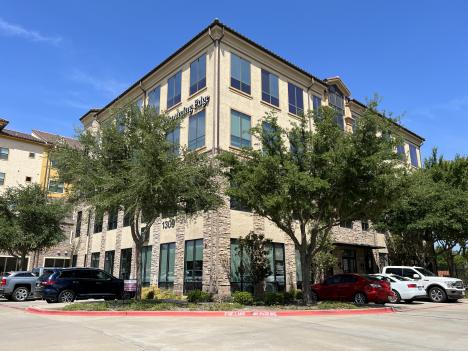
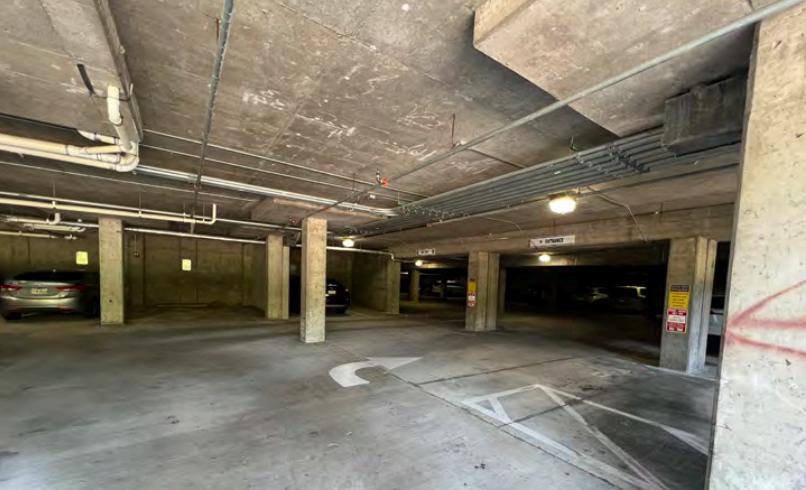
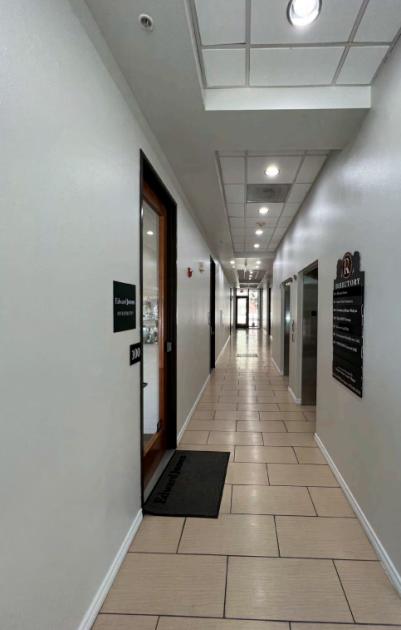
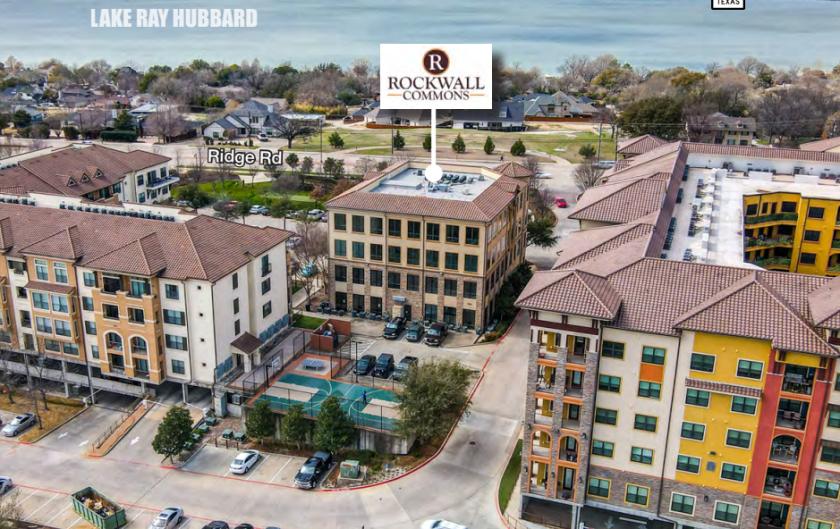
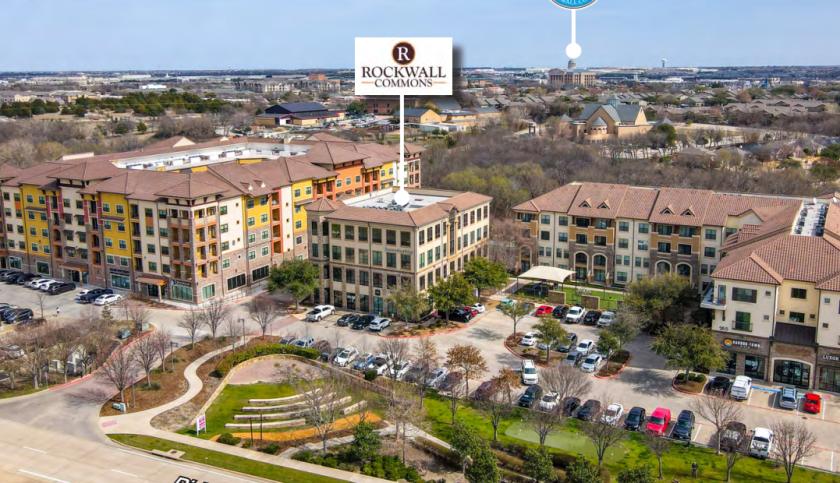
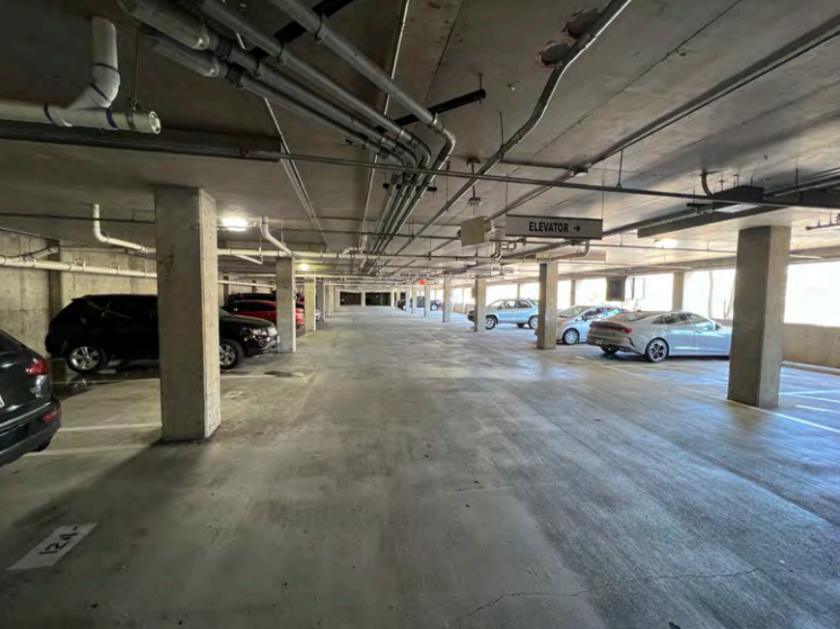
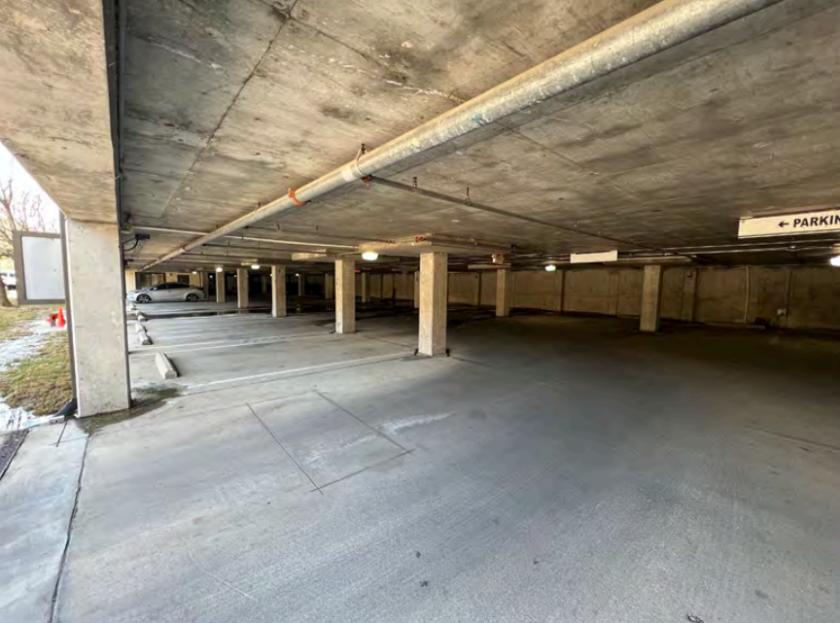
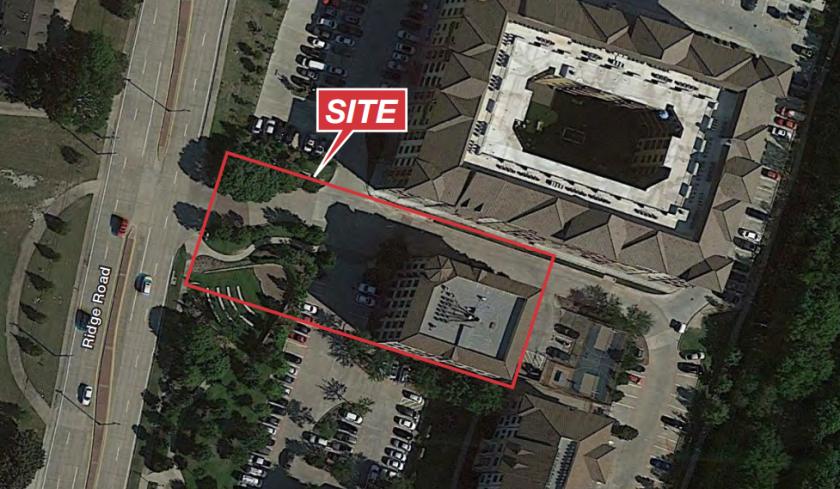
Rockwall Commons (the “Property”) is situated on .8047 acres on the east side of Ridge Road approximately 2 miles north of Interstate 30 and ½ mile south of Goliad Street. Ridge Road is a major N/S thoroughfare through Rockwall with a 17,800 VPD traffic count. The property was developed in a master-planned mixed-use project which includes multi-family, retail and office. Constructed in 2007, the Property is improved with of one 4-story building with underground parking with a rent roll of 7 tenants. Rockwall is a small, exurban office submarket on the eastern edge of the Dallas-Fort Worth metroplex. Unlike most outlying submarkets in D-FW, Rockwall has delivered large multi-tenant office buildings over the last decade. The inventory has grown to 2.2 million SF compared to 1.5 million SF in 2010. The 110,000-SF Trend Tower was completed in 2014 and usually stays around 95% leased. However, most new supply consists of smaller assets used by local businesses and medical users. Development activity has picked up; K.E. Andrews delivered an 80,000 SF multi-tenant building in March 2022.The acquisition of Rockwall Commons offers an investor built-in market rent growth, stable occupancy, and a bestin-class office location in a one of the highest demographic areas of DFW. The average household income within a 10-minute drivetime is over $135,000.The Rockwall office submarket contains 2.2 million square feet of office space. Demand is robust with 7.3% vacant, well below the overall DFW market. Many key decision makers opt to locate offices in the Rockwall area near their home and community which offers lakefront views and abundant shopping and entertainment. Rockwall ISD received an ‘A’ district accountability rating from the Texas Education Agency. There is a diverse and abundant supply of housing from executive lakefront homes to over 6,500 multifamily units.