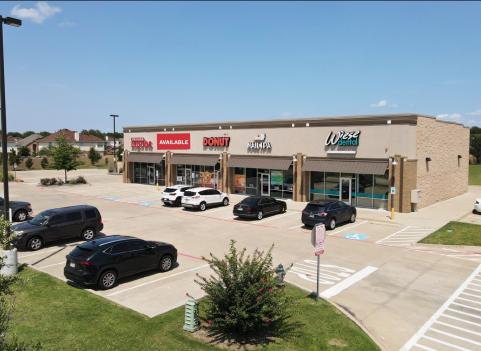
Retail Space
6810 Murphy Road Sachse, TX 75048
6810 Murphy Road Sachse, TX 75048
Details & Description
Property Highlights
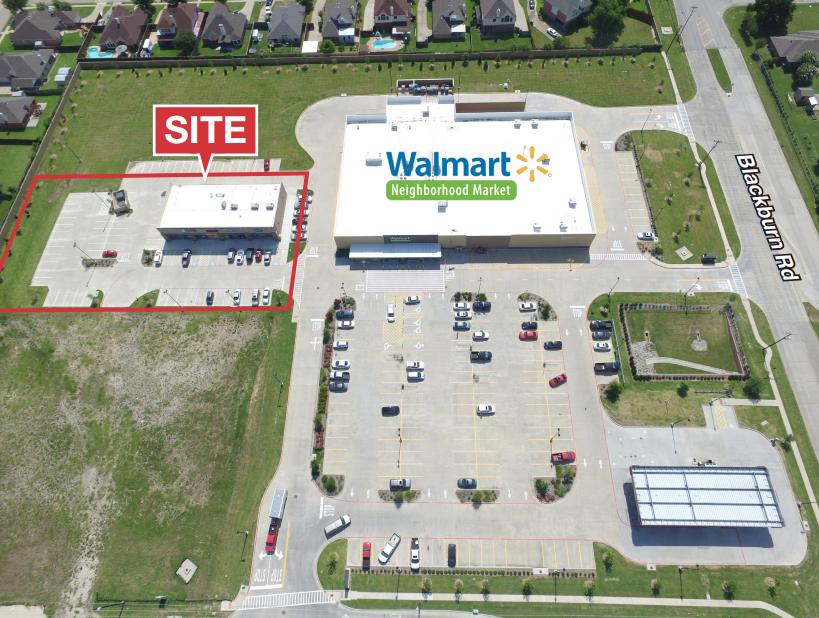
- • Shadowed by Walmart
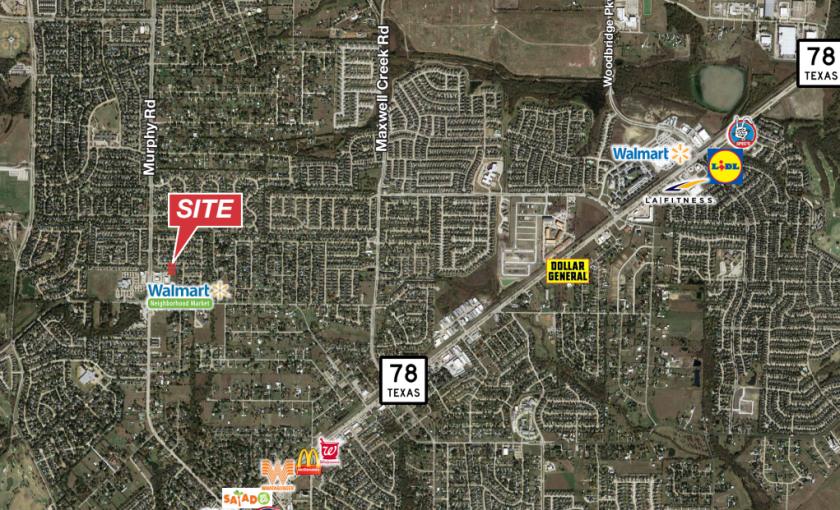
- • Easy Access to Hwy 78
- • Rapid Growth in Sachse and Surrounding Cities
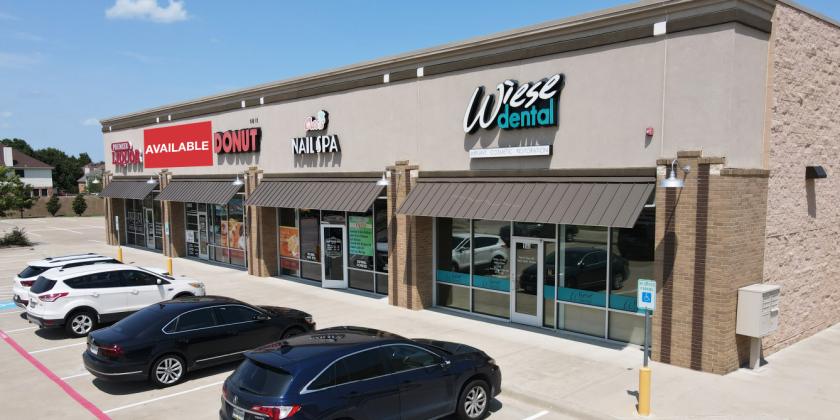
Additional Photos
Listing Agents

Lanie Richards
O: 214-256-7187
M: 817-691-7928
lrichards@nairl.com
O: 214-256-7187
M: 817-691-7928
lrichards@nairl.com
While we strive to provide the most accurate information, all listing information, and demographic data, is provided by third-parties. As such, MyEListing will not be responsible for the accuracy of the information. It is strongly recommended that you verify all information with the listing agent, and any relevant agencies, prior to making any decisions.


