Office Space
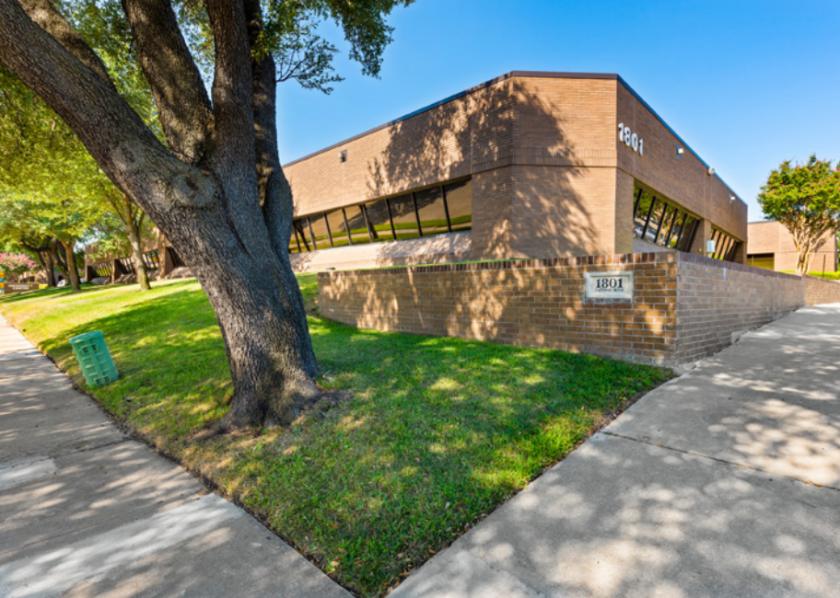
1801 Gateway Boulevard Richardson, TX 75080
1801 Gateway Boulevard Richardson, TX 75080
Details & Description
Property Highlights
- • Building Class: B
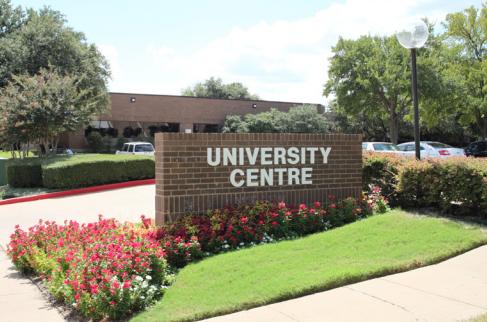
- • Building Signage
- • Recessed Entrances
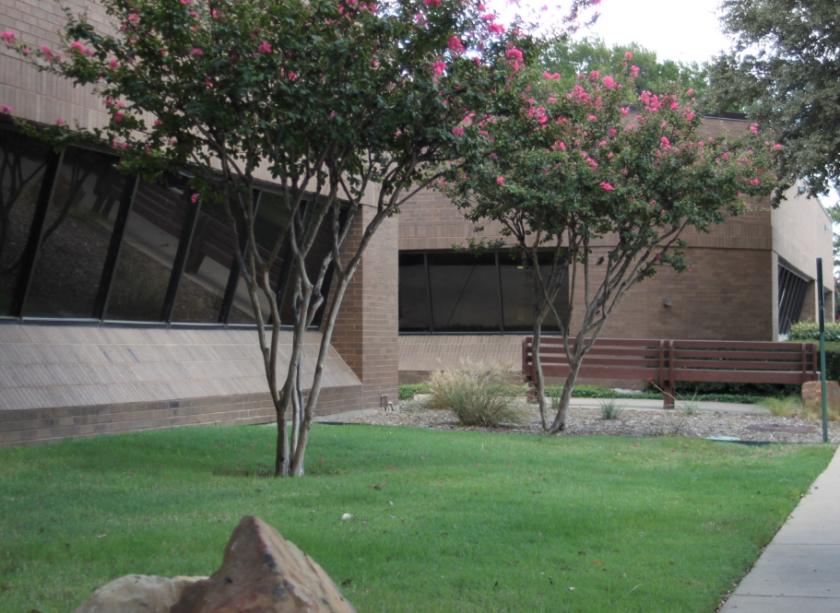
- • All Brick Exterior with Cantilevered Windows
- • Building Access Code Control System
- • 5.95/1,000 Parking
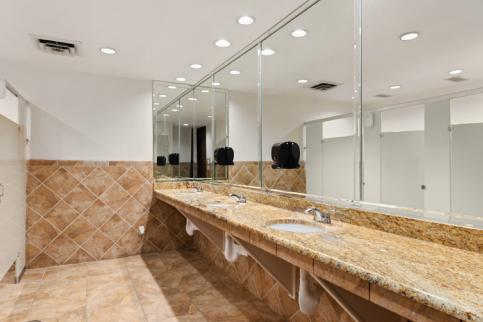
Additional Photos
Listing Agents

James Davis
O: 214-256-7103
M: 214-435-3382
jdavis@nairl.com
O: 214-256-7103
M: 214-435-3382
jdavis@nairl.com

Grant Frerichs
O: 214-256-7146
M: 214-601-0722
gfrerichs@nairl.com
O: 214-256-7146
M: 214-601-0722
gfrerichs@nairl.com

Justin Utay
O: 214-256-7166
M: 214-394-3148
jutay@nairl.com
O: 214-256-7166
M: 214-394-3148
jutay@nairl.com
While we strive to provide the most accurate information, all listing information, and demographic data, is provided by third-parties. As such, MyEListing will not be responsible for the accuracy of the information. It is strongly recommended that you verify all information with the listing agent, and any relevant agencies, prior to making any decisions.


