Office Space
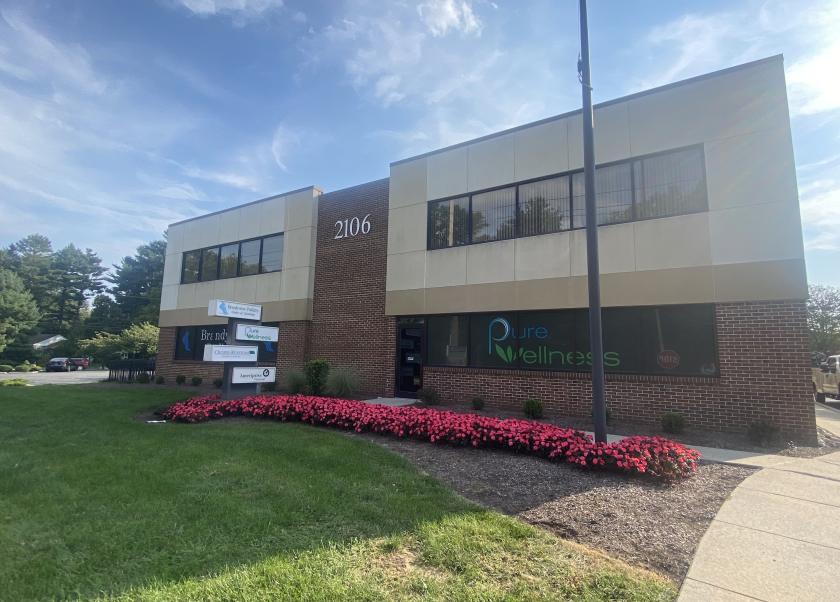
2106 Silverside Road, 1st Floor Wilmington, DE 19810
2106 Silverside Road, 1st Floor Wilmington, DE 19810
Details & Description
Property Highlights
• Ample parking and access from Marsh and Silverside Roads
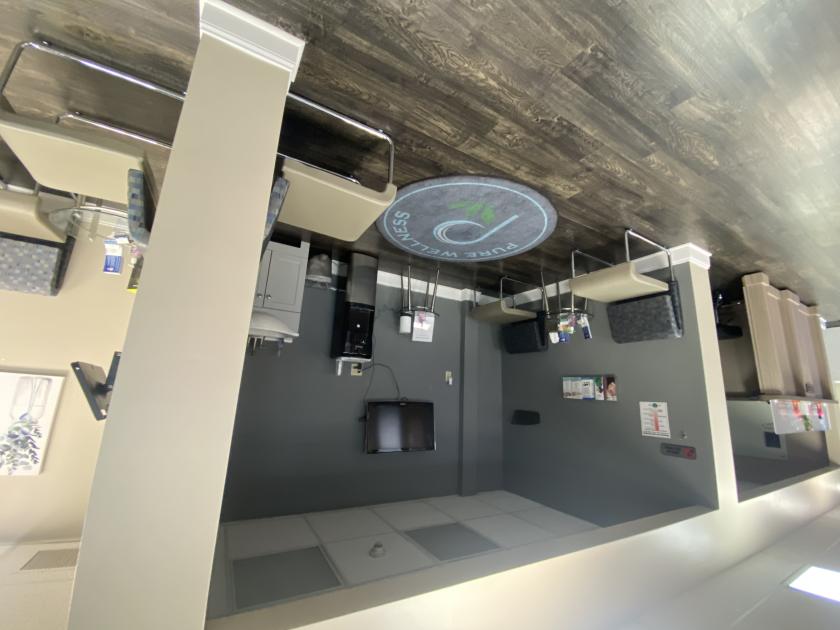
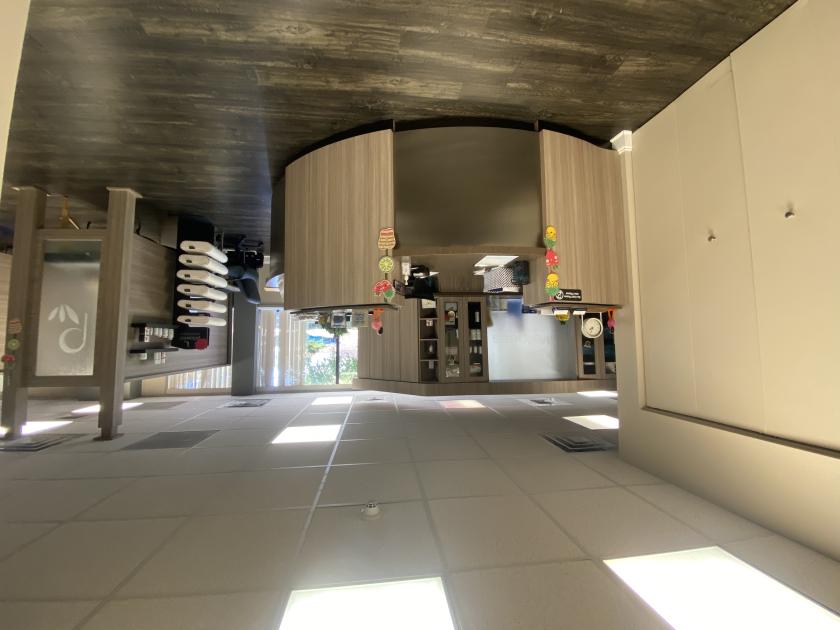
• General office perfect for a practiioner
Listing Agents

Rich Dudek
O: 302-656-6870
M: 302-893-7937
dudek@pattersonwoods.com
O: 302-656-6870
M: 302-893-7937
dudek@pattersonwoods.com
While we strive to provide the most accurate information, all listing information, and demographic data, is provided by third-parties. As such, MyEListing will not be responsible for the accuracy of the information. It is strongly recommended that you verify all information with the listing agent, and any relevant agencies, prior to making any decisions.